 Quick View
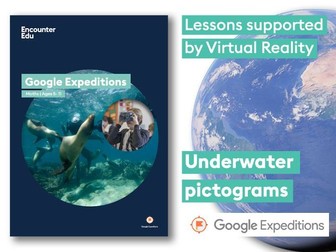
Pictograms #GoogleExpeditions Lesson
This #GoogleExpeditions lesson develops student skills in data representation and the use of pictograms.
Students start by using pictograms to represent the amount of fruit they have eaten and will eat. They then take a trip through a series of underwater vistas, recording the frequency of different types of sea creatures. They then apply their knowledge of data representation to create frequency pictograms.
Google Expeditions are immersive 360 degree photo stories designed for use in the classroom. For more see: https://www.google.com/edu/expeditions/
To download Google Docs versions of the lesson plan and student sheet go to: https://goo.gl/6v0jau