 Quick View
Maths Representing and Interpreting Data
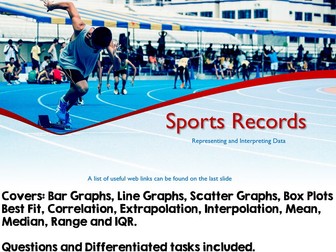
Used for Representing and Interpreting data, this resource will get students to create various graphs and charts, calculate Mean, Median, IQR etc. Includes differentiated tasks and interpolation and extrapolation from scatter graphs.
Students will draw bar, line, scatter graphs, boxplots and lines of best fit when completing tasks as well as answer questions about the data they have produced.