 Quick View
Year 7 Maths: Warhammer 40k Pictograms & Bar Charts – 30‑minute KS3 lesson
Overview
A ready-to-use, Warhammer 40k‑themed 30‑minute lesson for Year 7 (KS3) designed for a single pupil or 1:1 home education. Ideal for middle‑ability learners who need short, engaging tasks and frequent feedback.
National Curriculum links
KS3 Mathematics: construct and interpret tables, charts and diagrams; use statistical diagrams for discrete data including bar charts.
Learning objective
Pupils will interpret and construct pictograms and bar charts from discrete data.
What you get
Teacher notes with timings and classroom strategies for a 30‑minute lesson
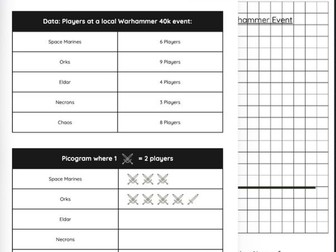
Copy‑and‑paste printable worksheet text (Warhammer 40k theme) with starter, main task and extension
Suggested answers and mark scheme
Differentiation and support ideas (scaffolds, kinaesthetic counters)
Extension tasks and assessment / plenary ideas
Lesson structure
Starter / hook (5 minutes) with pictogram questions
Short teaching input and modelling (7 minutes)
Main activity — draw a bar chart and answer questions (12 minutes)
Plenary / exit ticket (6 minutes)
Differentiation & support
Scaffolded grid and partially drawn axes for pupils who need it
Use of counters or miniatures for kinaesthetic learners
Extension tasks: percentage conversion, changing scales, critique of misleading charts
Resources required
Pencil, ruler, coloured pencils, simple timer
(Optional) small counters or Warhammer miniatures for hands‑on counting
Ideal for
Home educators, tutors, and teachers delivering 1:1 lessons
Year 7 pupils preparing for KS3 assessments or consolidating KS2 data skills