 Quick View
Calculating speed using Top Gear and the cast of Friends!
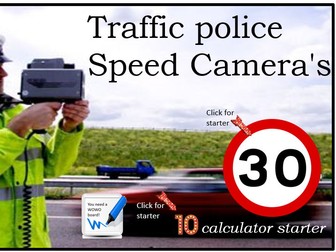
This real-world speed calculation lesson starts with an interactive hook: students watch three Top Gear clips to figure out how the hosts are trying to trick speed cameras. After a class discussion on the three main types of speed cameras, students learn how to calculate prosecution speeds and UK driving penalty points.
For the main activity, students analyse data for eight members of the Friends cast. Using four unique data points per character, they calculate their speeds to decide who gets a fine, who gets points, and who loses their driving licence! This resource perfectly blends rigorous speed calculations, rounding and percentages with lively debates on speed camera ethics, visibility, and road safety.