Bundle
 Quick View
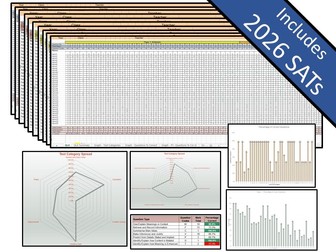
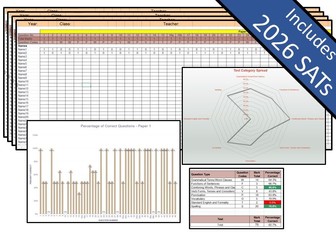
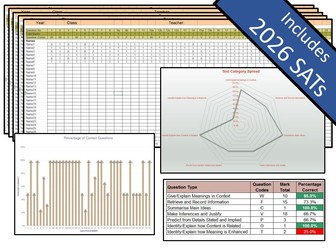
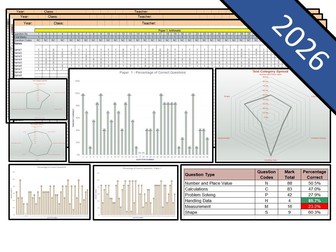
Comprehensive Key Stage 1 Question Level Analysis (QLA) Bundle - Maths, Reading and SPaG
Includes:
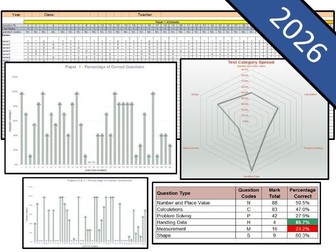
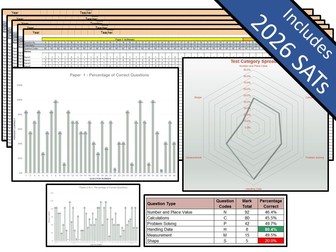
KS1 2026 Optional Maths SATs QLA
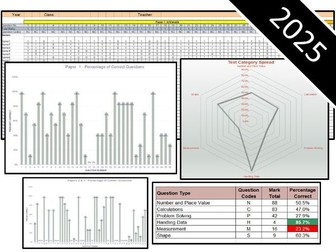
KS1 2025 Optional Maths SATs QLA
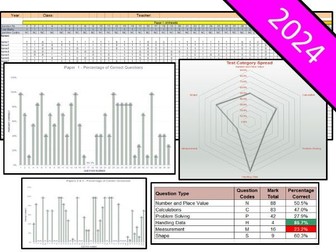
KS1 2024 Optional Maths SATs QLA
KS1 2023 Maths SATs QLA
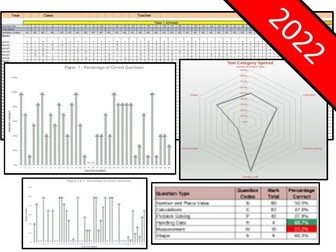
KS1 2022 Maths SATs QLA
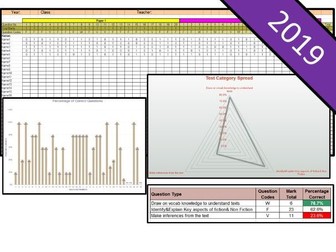
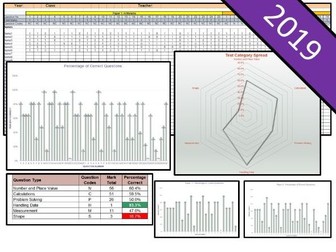
KS1 2019 Maths SATs QLA
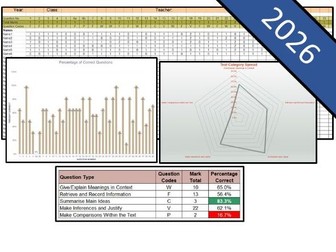
KS1 2026 Optional Reading SATs QLA
KS1 2025 Optional Reading SATs QLA
KS1 2024 Optional Reading SATs QLA
KS1 2023 Reading SATs QLA
KS1 2022 Reading SATs QLA
KS1 2019 Reading SATs QLA
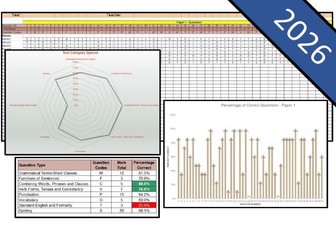
KS1 2026 Optional SPaG SATs QLA
KS1 2025 Optional SPaG SATs QLA
KS1 2024 Optional SPaG SATs QLA
KS1 2023 SPaG SATs QLA
KS1 2022 SPaG SATs QLA
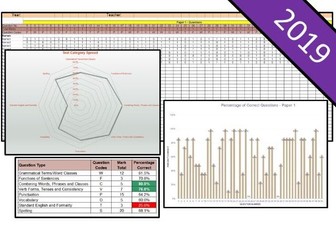
KS1 2019 SPaG SATs QLA
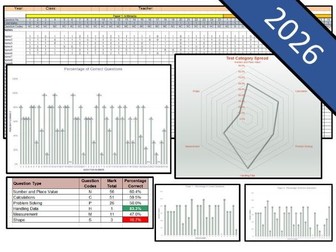
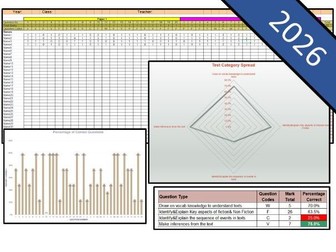
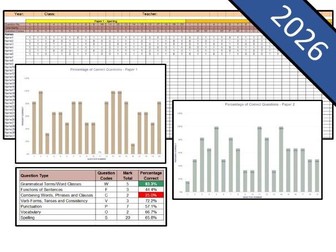
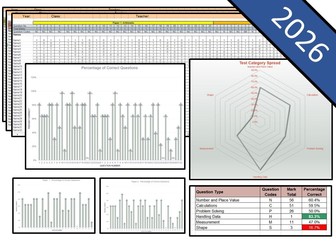
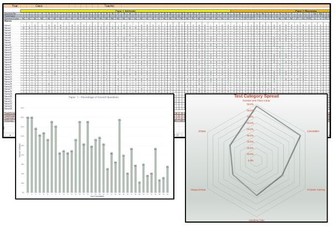
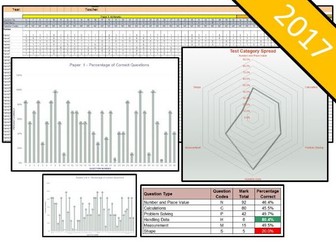
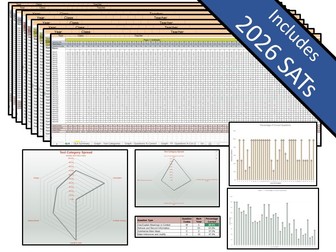
Easy to use Excel Spreadsheets to analyse the above test scores using Question Level Analysis (QLA). Will highlight students’ areas of strength and weaknesses in key maths (number, calculation, problem solving, handling data, shape and measurement), reading (drawing on knowledge of vocabulary to understand texts; identifying and explaining key aspects of fiction and non-fiction texts, such as characters, events, titles and information; identifying and explaining the sequence of events in texts; making inferences from texts; and predicting what might happen on the basis of what has been read so far) and SPaG (grammatical terms/word classes; functions of sentences; combining words, phrases and clauses; verb tenses and consistency; punctuation; vocabulary; and spelling) areas. Simply add the students’ name and their score and the spreadsheet will update and produce graphs based on their answers.