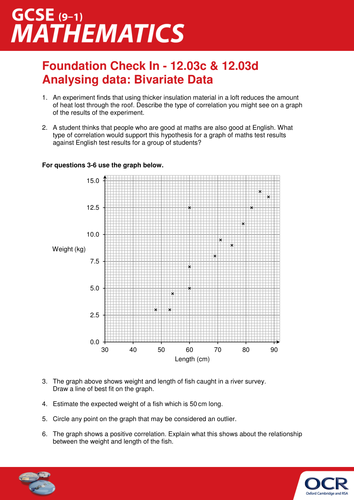
A 10 question test on Analysing data, comprising: 5 questions on procedural calculations; 3 questions on reasoning and communicating mathematically; and 2 problem solving questions. At the end of the test there is an extension activity which will allow more able students to stretch themselves. This resource is ideal for either formative or summative assessment and can be used in lesson time as a topic assessment, starter or plenary activity or for homework or revision.
Topics include:
Bivariate data:
Plot and interpret scatter diagrams for bivariate data.
Recognise correlation.
Interpret correlation within the context of the variables, and appreciate the distinction between correlation and causation.
Draw a line of best fit by eye, and use it to make predictions.
Interpolate and extrapolate from data, and be aware of the limitations of these techniques.
Outliers:
Identify an outlier in simple cases.
Appreciate there may be errors in data from values (outliers) that do not ‘fit’.
Recognise outliers on a scatter graph.
Visit Teach Cambridge for more resource ideas.
Something went wrong, please try again later.
just what I wanted, thanks
Report this resourceto let us know if it violates our terms and conditions.
Our customer service team will review your report and will be in touch.
