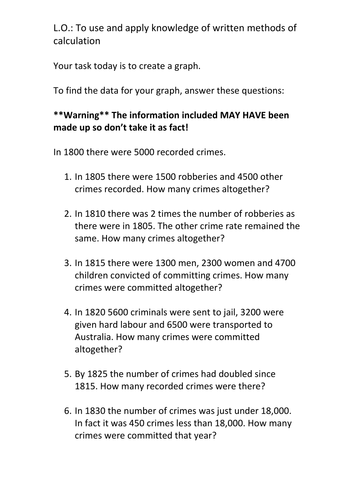


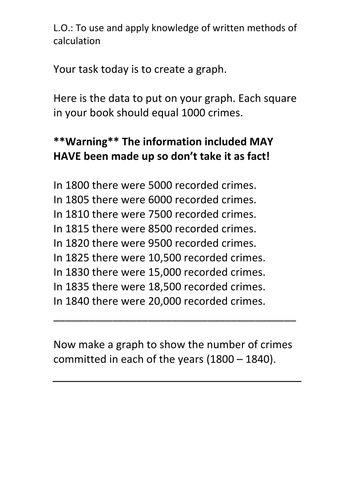
A cross-curricular Maths and History (Crime and Punishment since 1066) activity based on crime rates in the Victorian times. Children will interpret the data, make a graph (bar or line) to represent the data then answer questions about the data.
There are three levels with the LA task using multiples of 1000, the MA task using mutliples of 100 and requiring a range of calculations to find what the data is to put on their graphs and the HA task using 4 digit numbers and again requiring a range of calculations to find what the data is to put on their graphs.
There are three levels with the LA task using multiples of 1000, the MA task using mutliples of 100 and requiring a range of calculations to find what the data is to put on their graphs and the HA task using 4 digit numbers and again requiring a range of calculations to find what the data is to put on their graphs.
Something went wrong, please try again later.
Excellent to help with cross curricular topic work. Thank you
A good way of making graph work more interesting. Thanks for sharing!
Not ready to use this straight away but looks a very useful activity - thank you for sharing
Report this resourceto let us know if it violates our terms and conditions.
Our customer service team will review your report and will be in touch.
£0.00