Looking for effective scale drawing practice worksheet resources for ks3
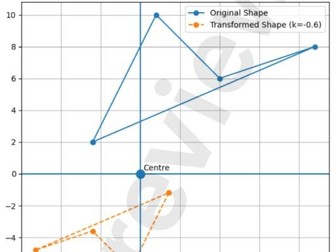
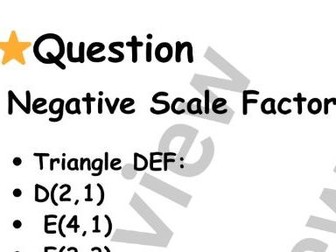
This engaging math activity helps students understand enlargements and transformations using a negative scale factor GCSE approach. Perfect for middle school or GCSE preparation, these printable worksheets make learning scale drawings clear, visual, and fun. Great for teachers, homeschooling, or extra math practice.
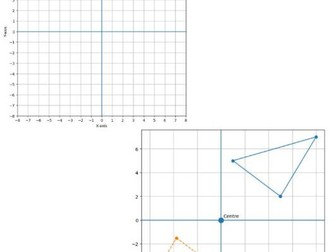
drawing scale figures worksheet ,similar figures and negative scale factor dilation
drawing scale figures worksheet ,similar figures and reduction scale factor
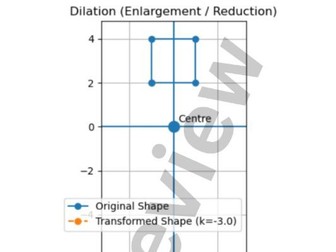
This resource focuses on transformation enlargement with negative scale factor, helping learners understand reflections through the center, fractional enlargements, and coordinate grid transformations through clear practice and guided examples — perfect for middle and high school geometry lessons.
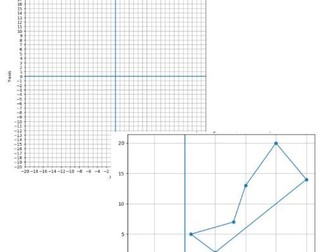
scale factor in a dilation results in an enlarged figure
dilation scale factor negative
This resource focuses on transformation enlargement with negative scale factor, helping learners understand reflections through the center, fractional enlargements, and coordinate grid transformations through clear practice and guided examples — perfect for middle and high school geometry lessons.
Fractional Scale Factors for Enlargements KS4 Foundation Walkthrough Worksheet
This resource focuses on transformation enlargement with negative scale factor, helping learners understand reflections through the center, fractional enlargements, and coordinate grid transformations through clear practice and guided examples — perfect for middle and high school geometry lessons.
enlargement negative fractional scale factor worksheet
transformation enlargement negative scale factor
This resource focuses on dilation/transformation enlargement with negative scale factor, helping learners understand reflections through the center, fractional enlargements, and coordinate grid transformations through clear practice and guided examples — perfect for middle and high school geometry lessons.
enlargement with negative scale factor worksheet
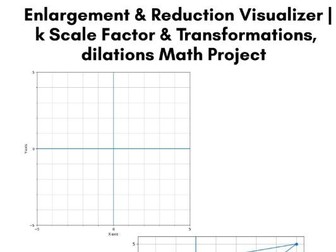
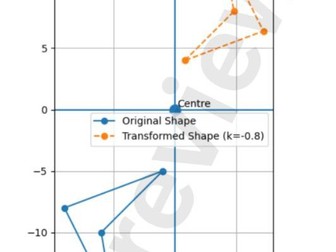
Enlargement & Reduction (Dilation) Visualizer | Scale Factor Transformation on Coordinate Plane
Interactive math activity that helps students visualize enlargement, reduction, and negative scale factors on the coordinate plane. Perfect for Grade 7–9 geometry, GCSE transformations, and STEM coding lessons.
enlargement with negative scale factor worksheet
Enlargement & Reduction (Dilation) Visualizer | Scale Factor Transformation on Coordinate Plane
Interactive math activity that helps students visualize enlargement, reduction, and negative scale factors on the coordinate plane. Perfect for Grade 7–9 geometry, GCSE transformations, and STEM coding lessons.
l’épiphanie La galette des rois | Lecture et compréhension – Cycle 1 & Cycle 2 (France & Canada)
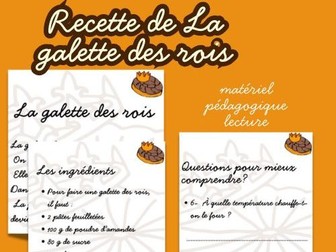
Ce document sur la galette des rois est une activité pédagogique idéale pour développer la lecture, la compréhension de texte et le vocabulaire chez les enfants du cycle 1 et cycle 2, conformément aux programmes scolaires français et canadiens (Québec).
À travers une recette simple et structurée, les élèves découvrent les ingrédients, les étapes de préparation et les traditions liées à la galette des rois, tout en renforçant leurs compétences en lecture fonctionnelle et en compréhension écrite.
Ce support est parfaitement adapté aux classes de maternelle, CP, CE1, ainsi qu’aux élèves ayant besoin d’un soutien en lecture ou d’une approche différenciée. Idéal pour une utilisation en classe, en orthopédagogie, en FLS/FLE ou à la maison.
Logarithmic Functions Graphing – Step-by-Step Sketching, Domain, Asymptotes & End Behavior (Student-Friendly Guide)
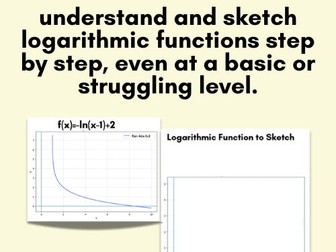
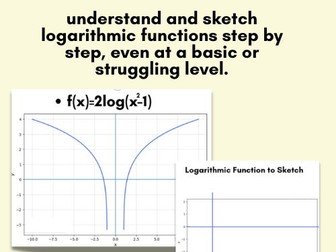
This resource helps students understand and sketch logarithmic functions step by step, even at a basic or struggling level.
It includes clear explanations in simple language to analyze logarithmic graphs: number of branches, increasing or decreasing behavior, inverse functions, and end behavior.
Perfect for high school math, precalculus, algebra 2, and remedial or support classes, this guide is especially useful for weaker students, ESL learners, and students with learning difficulties.
Students learn how to:
Identify the domain of logarithmic functions
Recognize vertical asymptotes
Determine if a graph goes up or down
Understand end behavior clearly
Compare logarithmic graphs with their inverse functions
Ideal for:
✔ Classroom instruction
✔ Homework support
✔ Exam revision
✔ Differentiated instruction
✔ Special education and inclusion settings
This resource focuses on conceptual understanding, not memorization, making logarithmic graphing clear, accessible, and confidence-building for all learners.
logarithmic functions graphing, sketching logarithmic graphs, logarithm graph worksheet, domain and asymptotes logarithm, end behavior logarithmic functions, precalculus logarithms, algebra logarithmic graphs, student friendly math guide, simplified math explanations, inverse logarithmic functions
Logarithmic Functions Graphing – Step-by-Step Sketching, Domain, Asymptotes & End Behavior (Student-Friendly Guide)
This resource helps students understand and sketch logarithmic functions step by step, even at a basic or struggling level.
It includes clear explanations in simple language to analyze logarithmic graphs: number of branches, increasing or decreasing behavior, inverse functions, and end behavior.
Perfect for high school math, precalculus, algebra 2, and remedial or support classes, this guide is especially useful for weaker students, ESL learners, and students with learning difficulties.
Students learn how to:
Identify the domain of logarithmic functions
Recognize vertical asymptotes
Determine if a graph goes up or down
Understand end behavior clearly
Compare logarithmic graphs with their inverse functions
Ideal for:
✔ Classroom instruction
✔ Homework support
✔ Exam revision
✔ Differentiated instruction
✔ Special education and inclusion settings
This resource focuses on conceptual understanding, not memorization, making logarithmic graphing clear, accessible, and confidence-building for all learners.
logarithmic functions graphing, sketching logarithmic graphs, logarithm graph worksheet, domain and asymptotes logarithm, end behavior logarithmic functions, precalculus logarithms, algebra logarithmic graphs, student friendly math guide, simplified math explanations, inverse logarithmic functions
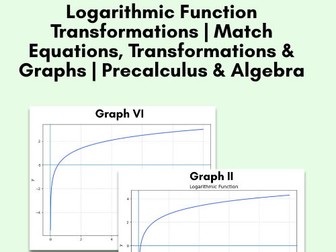
Logarithmic Function Transformations | Match Equations, Transformations & Graphs | Precalculus & Algebra
Help students master logarithmic function transformations with this engaging match-the-equation, transformation, and graph activity. Students analyze logarithmic equations, identify the type of transformation, and then match each equation to its corresponding graph. This activity is ideal for learners who are just beginning to explore logarithmic functions and their transformations.
Students practice identifying:
Horizontal shifts (left & right)
Vertical shifts (up & down)
Reflections across the x-axis
Horizontal compression
Vertical asymptotes of logarithmic functions
This resource supports conceptual understanding by connecting algebraic expressions, graphical behavior, and function transformations, making it perfect for Precalculus, Algebra 2, and introductory AP courses.
What’s Included
Matching activity: logarithmic equation → transformation → graph
Clear focus on the parent function y=log(x)y=\log(x)y=log(x)
Student-friendly layout for guided practice or independent work
Teacher answer key included
Works as a worksheet, card sort, or math center activity
Ideal For
Precalculus & Algebra 2 classes
Introducing logarithmic transformations
Test preparation & review
Visual and kinesthetic learners
Homemade Cheese Recipe –Visual Support for Primary Students
Homemade Cheese Recipe – Step-by-Step Science Activity for Neurodivergent Children (ASD, ID) | Visual Support for Primary Students
This homemade cheese recipe, presented step by step using clear and simple language, is specially designed for children with reading difficulties who benefit from enhanced visual support. It is an ideal hands-on science and sensory activity for primary school, special education, and neurodivergent learners, including those with Autism Spectrum Disorder (ASD) and/or Intellectual Disability (ID).
This resource can be used in regular classrooms, special education programs, or at home, promoting independence, step-by-step understanding, and learning through hands-on experience.
Recette du Fromage Maison – Activité Scientifique Pas à Pas pour Enfants Neuroatypiques (TSA, DI) | Support Visuel Primaire
Cette recette du fromage maison, présentée pas à pas avec un langage simple et clair, est spécialement conçue pour les enfants ayant des difficultés de lecture et nécessitant un soutien visuel renforcé. Elle constitue une activité scientifique et sensorielle idéale pour le primaire, l’adaptation scolaire et sociale, ainsi que pour les élèves neuroatypiques, notamment ceux présentant un trouble du spectre de l’autisme (TSA) et/ou une déficience intellectuelle (DI).
Ce document peut être utilisé en classe régulière, dans les programmes CAPS et DÉFIS, ou à la maison, favorisant l’autonomie, la compréhension des étapes, et l’apprentissage par la manipulation.
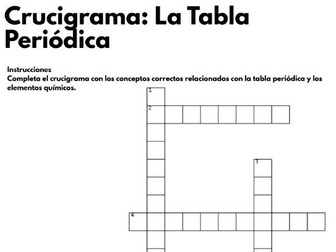
Crucigrama de la tabla periódica: actividad educativa de química para estudiantes
Aprende y refuerza conceptos clave de química con este crucigrama de la tabla periódica, una actividad didáctica ideal para estudiantes de primaria y secundaria. Incluye términos esenciales como elementos químicos, símbolos, número atómico y grupos de la tabla periódica, fomentando el aprendizaje activo, la memoria y la comprensión de forma divertida y educativa. Perfecto para clases de ciencias, tareas y material imprimible.
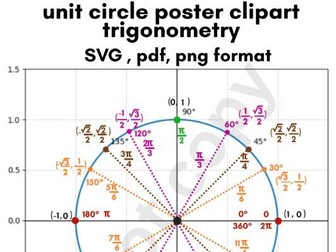
Unit Circle Poster Printable | Trigonometry Chart | Degrees & Radians | Math Classroom Wall Art
Teach trigonometry visually with this Unit Circle poster! A clear and engaging math chart showing key angles in degrees and radians with trig values. Perfect for classroom decor, study guides, and student reference tools.
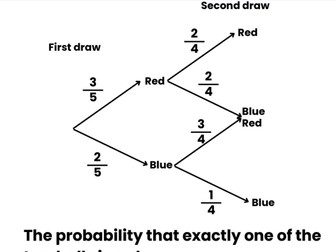
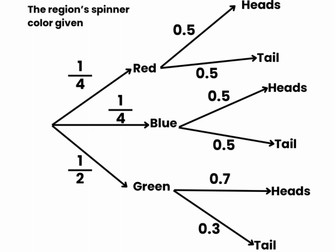
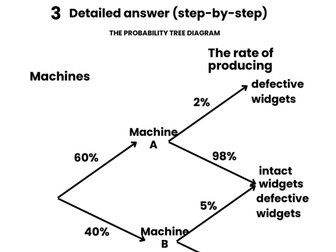
these probability tree diagram word problems fit well in a “Compound Probability” and “Tree Diagrams” lesson — often placed after introducing basic probability and before conditional probability or Venn diagrams.
Objectives:
Use tree diagrams to calculate probabilities of a combination of events.
Use tree diagrams to calculate probabilities of conditional events.
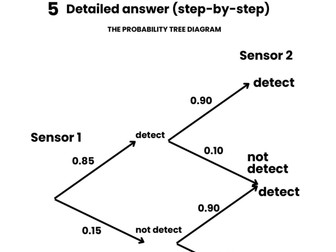
 Quick View