Logarithmic Functions Graphing – Step-by-Step Sketching, Domain, Asymptotes & End Behavior (Student-Friendly Guide)
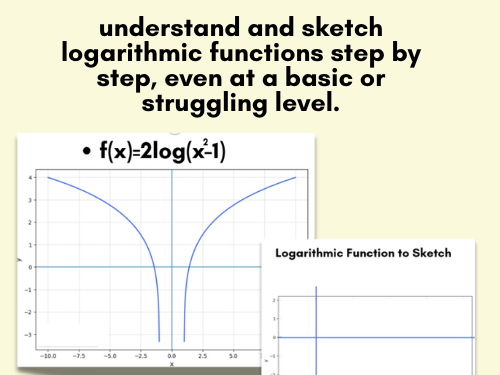
This resource helps students understand and sketch logarithmic functions step by step, even at a basic or struggling level.
It includes clear explanations in simple language to analyze logarithmic graphs: number of branches, increasing or decreasing behavior, inverse functions, and end behavior.
Perfect for high school math, precalculus, algebra 2, and remedial or support classes, this guide is especially useful for weaker students, ESL learners, and students with learning difficulties.
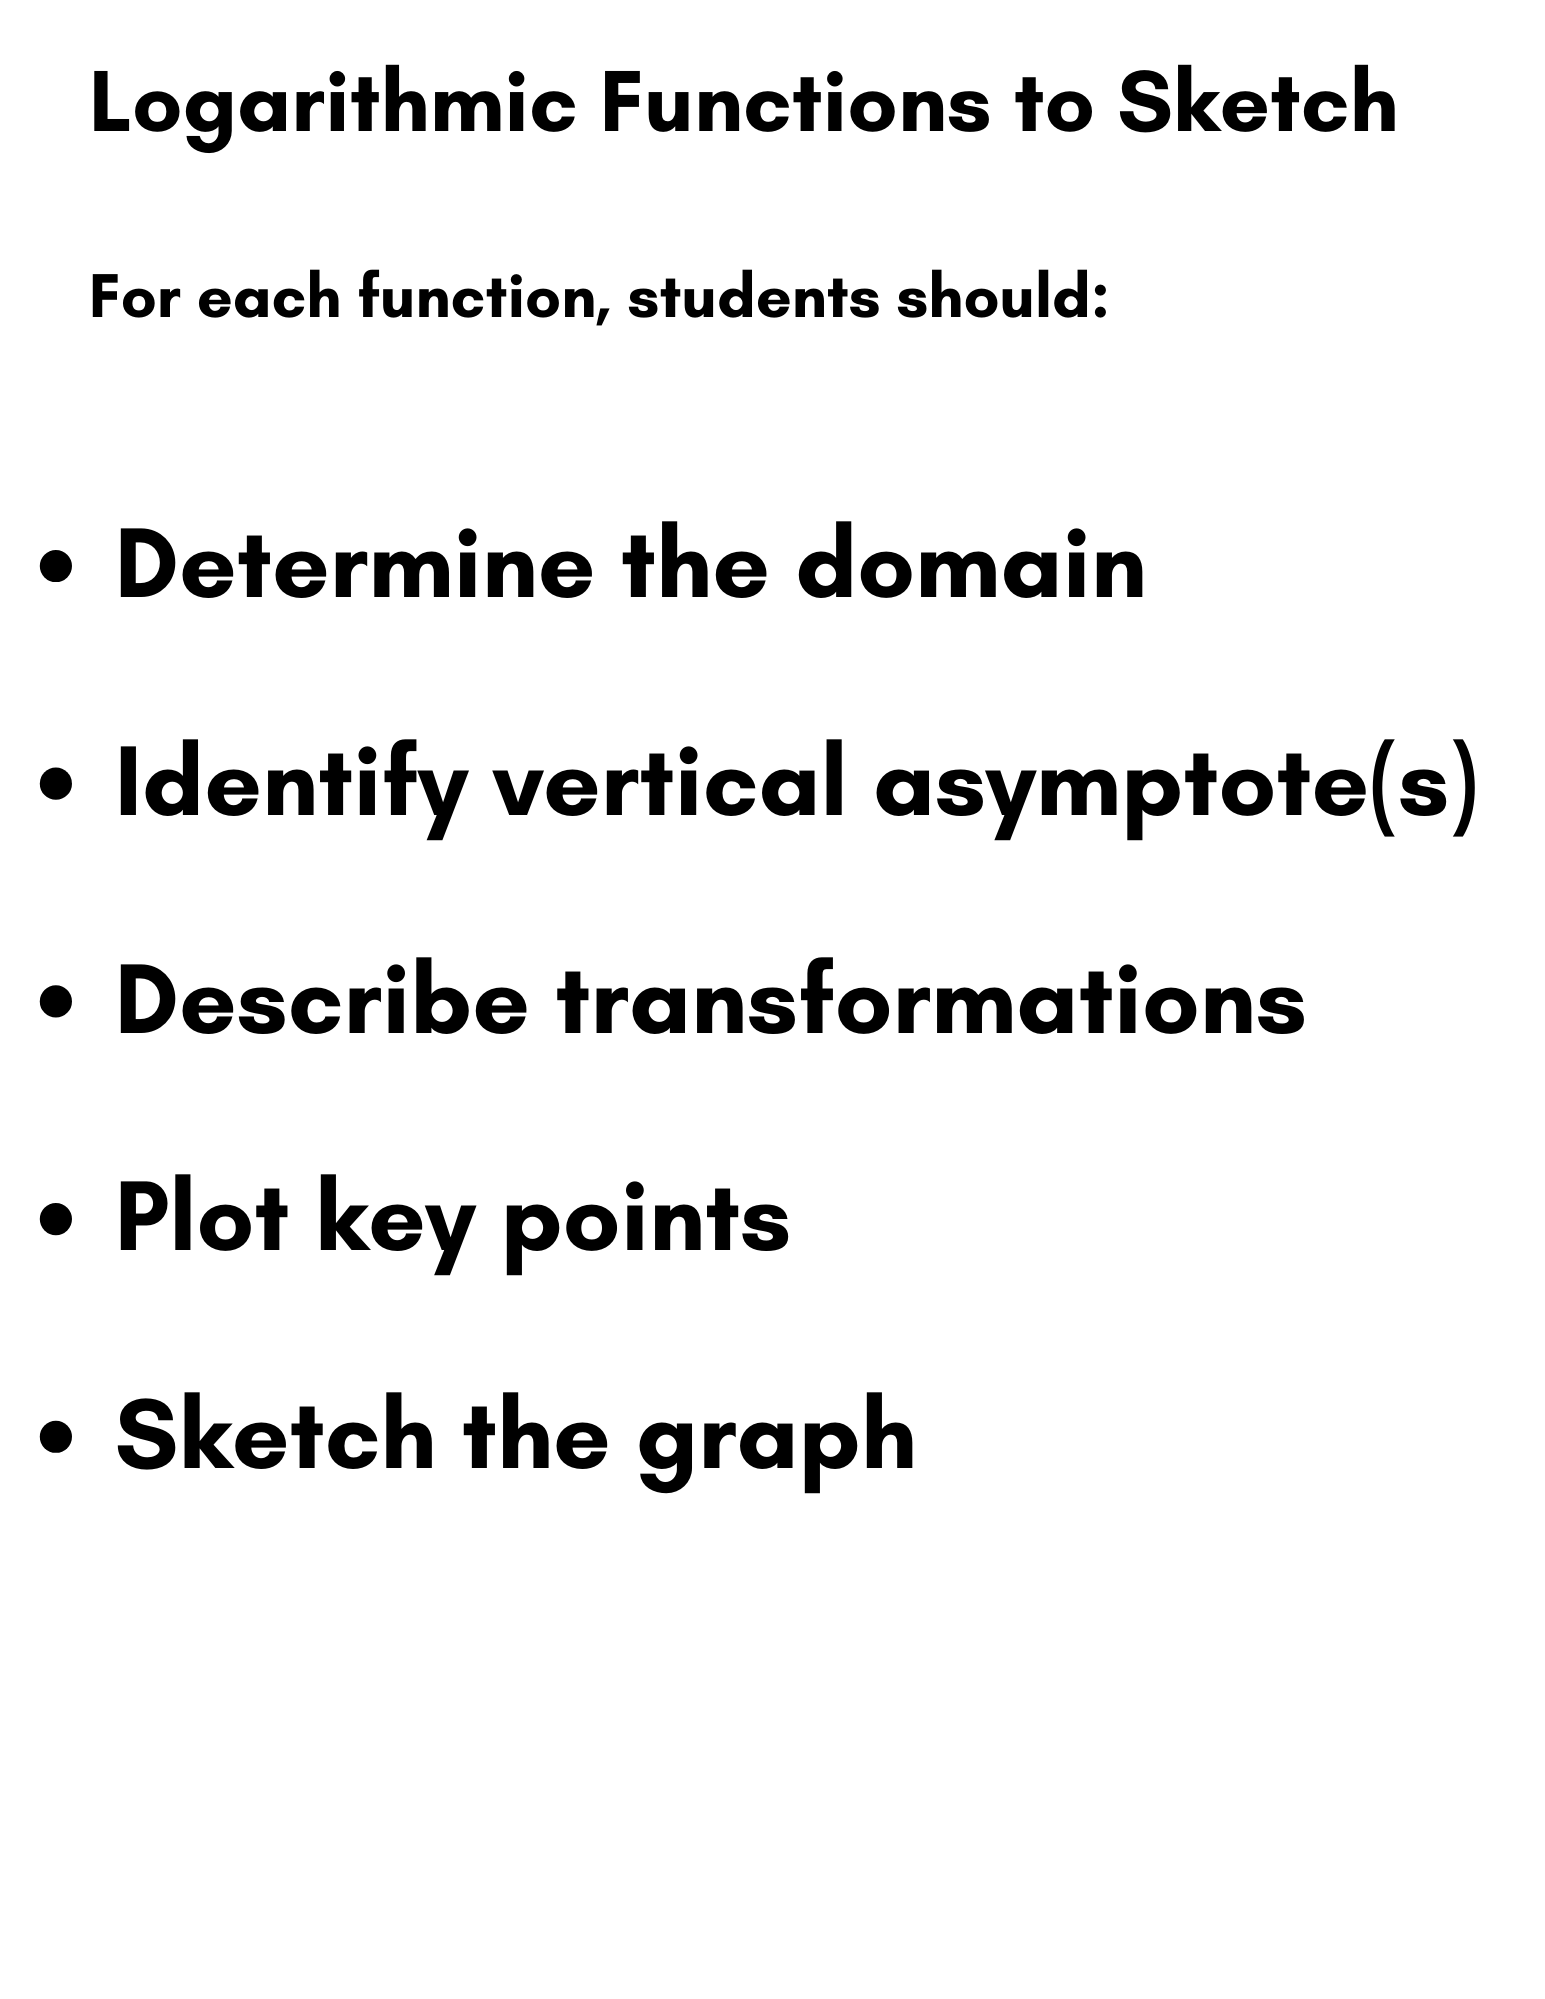
Students learn how to:
Identify the domain of logarithmic functions
Recognize vertical asymptotes
Determine if a graph goes up or down
Understand end behavior clearly
Compare logarithmic graphs with their inverse functions
Ideal for:
✔ Classroom instruction
✔ Homework support
✔ Exam revision
✔ Differentiated instruction
✔ Special education and inclusion settings
This resource focuses on conceptual understanding, not memorization, making logarithmic graphing clear, accessible, and confidence-building for all learners.
logarithmic functions graphing, sketching logarithmic graphs, logarithm graph worksheet, domain and asymptotes logarithm, end behavior logarithmic functions, precalculus logarithms, algebra logarithmic graphs, student friendly math guide, simplified math explanations, inverse logarithmic functions
Something went wrong, please try again later.
This resource hasn't been reviewed yet
To ensure quality for our reviews, only customers who have purchased this resource can review it
Report this resourceto let us know if it violates our terms and conditions.
Our customer service team will review your report and will be in touch.
$3.00