 Quick View
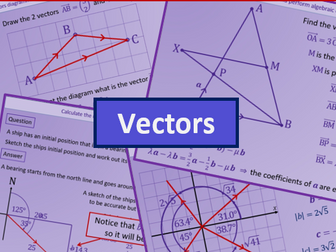
Vectors - A level AS Mathematics
These PowerPoints form full lessons of work that together cover the new A level Maths course for all exam boards. Together all the PowerPoints include;
• A complete set of notes for students
• Model examples
• Probing questions to test understanding
• Class questions including answers
• Individual whiteboard work
• Links to exercises in ‘The Textbook by CGP’ these can easily be edited for your textbook
The PowerPoints can be used in the lesson and also given to students that have missed a lesson
I have added ‘AS level maths 13 – Circles’ for free download
Vectors covers;
Use vectors in two dimensions
Calculate the magnitude and direction of a vector and convert between component form and magnitude/direction form
Add vectors diagrammatically and perform the algebraic operations of vector addition and multiplication by scalars, and understand their geometrical interpretations
Understand and use position vectors
Calculate the distance between two points represented by position vectors
Use vectors to solve problems in pure mathematics and in context, including forces