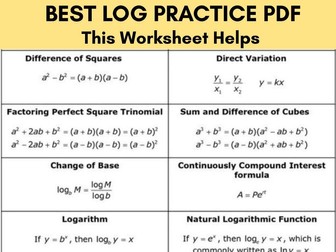
 Quick View
Prozentrechnung: 5 Sachaufgaben | Legasthenie & Inklusion
Kurzbeschreibung :5 praxiserprobte Sachaufgaben zur Prozentrechnung. Speziell optimiert für Schüler mit Legasthenie, Lese-Rechtschreib-Schwäche (LRS) und für den inklusiven Unterricht. Sofort einsetzbar, mit 100 % fehlerfreien, kleinschrittigen Lösungen!
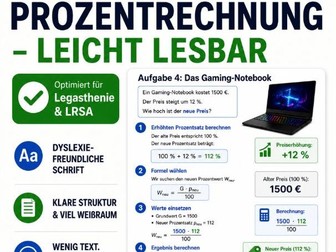
ausführliche Beschreibung:Suchen Sie nach Unterrichtsmaterial zur Prozentrechnung, das wirklich jeder Schüler versteht? Dieses Material wurde speziell für Jugendliche mit Legasthenie, LRS oder visuellem Förderbedarf entwickelt. Die lebensnahen Aufgaben (Smartphone, Gaming) sichern eine hohe Motivation!Das macht dieses Material besonders:Kurze Sätze: Maximal 10 Wörter pro Informationseinheit beugen Überforderung vor.Keine Textwüsten: Große Zeilenabstände und klare optische Trennungen erleichtern das Lesen.Visuelle Anker: Wichtige Zahlen und mathematische Kernbegriffe sind fett gedruckt.Schritt-für-Schritt-Lösung: Jede Aufgabe bietet einen detaillierten Rechenweg inklusive Formel und Einsetzung.Das ist enthalten:5 moderne Textaufgaben (Grundwert, Prozentwert, Prozentsatz, erhöhter Grundwert)5 detaillierte Lösungsseiten zur Selbstkontrolle oder für die Hand des LehrersIdeal für: Hauptschule, Realschule, Gesamtschule, Gymnasium (Klasse 7–9), Förderunterricht, Nachhilfe und Dyskalkulie-Training.