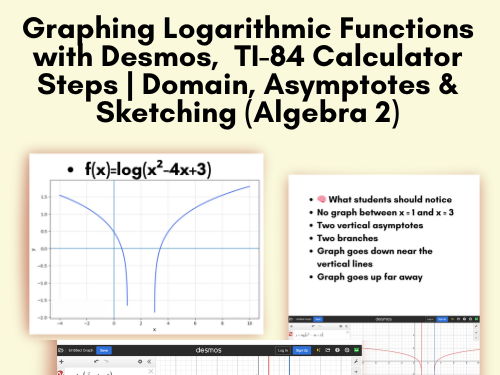
This resource supports students in graphing logarithmic functions using Desmos, with a strong focus on mathematical understanding rather than button-pressing.
Through the function
f(x)=log(x²−4x+3)
learners explore how domain restrictions affect the graph and why logarithmic graphs can have separate branches.
Students will:
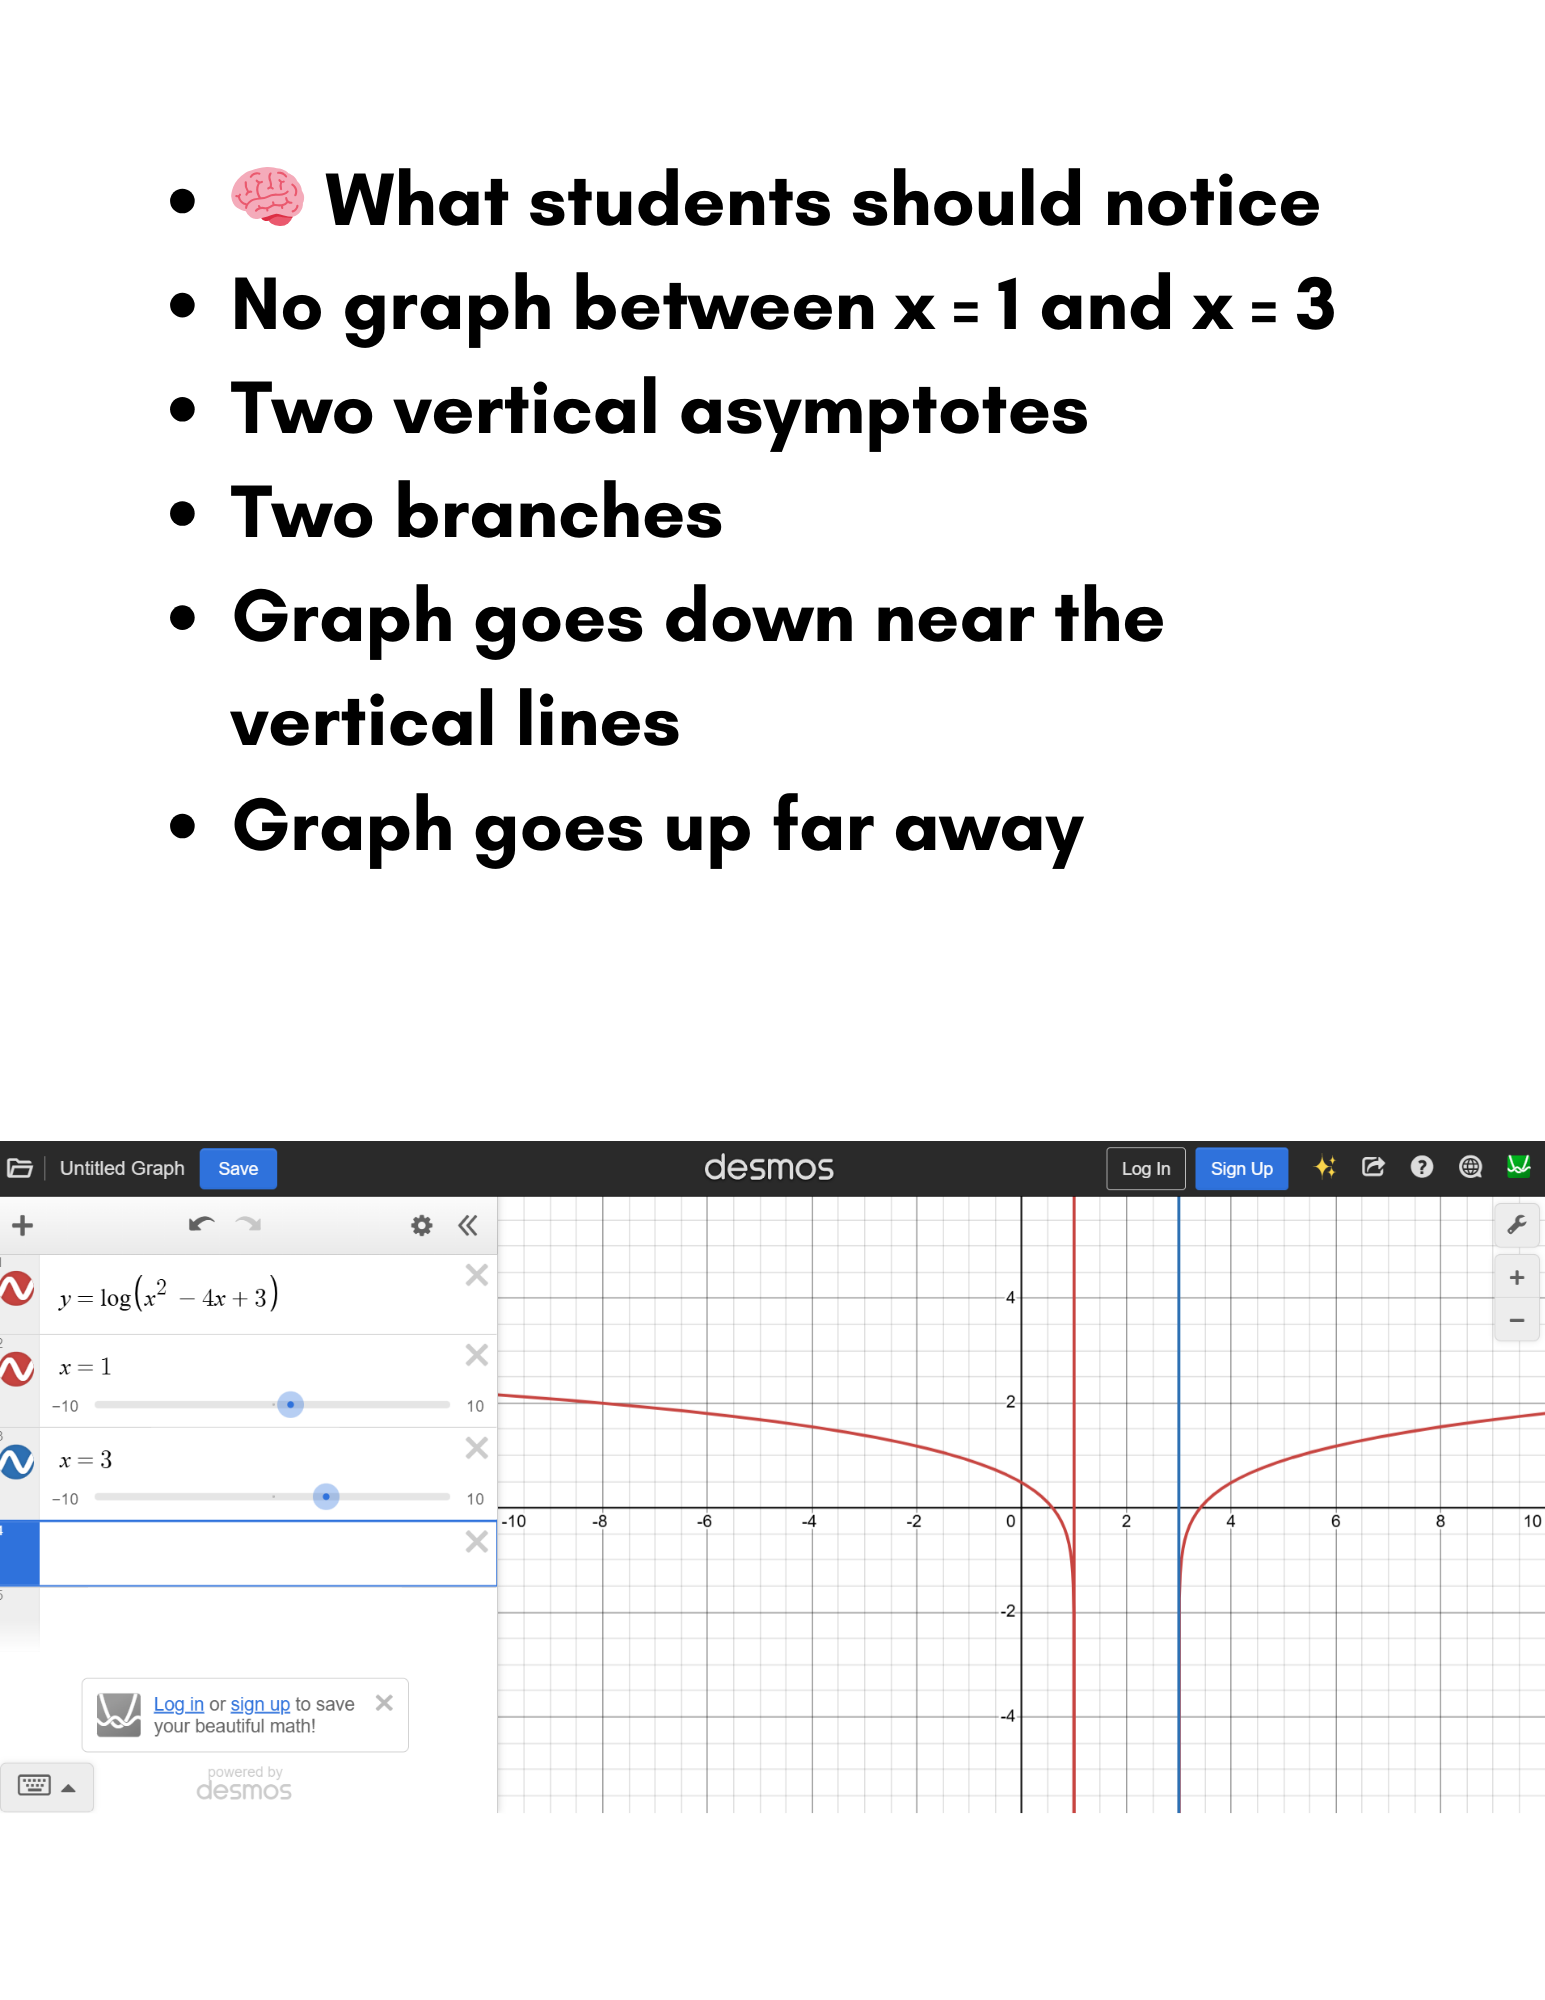
Use Desmos to plot logarithmic expressions
Identify where the function is defined
Locate vertical asymptotes
Describe graph behaviour clearly
Translate calculator output into accurate sketches
Suitable for:
✔ Secondary mathematics
✔ GCSE extension
✔ A-Level preparation
✔ International curricula
✔ EAL / lower-attaining learners
Clear, visual, and ideal for revision, demonstration, or independent learning.
logarithmic graphs, desmos maths, graphing logarithms, secondary maths functions, domain and asymptotes, sketching graphs, a level logarithms, maths revision
Get this resource as part of a bundle and save up to 44%
A bundle is a package of resources grouped together to teach a particular topic, or a series of lessons, in one place.
Bundle
Log Rules Worksheet (Product, Quotient, Power) | Algebra 2 / GCSE Maths
Boost your students’ confidence with this comprehensive Logarithm Worksheets Pack! Perfect for GCSE, Algebra 2, and high school math, this resource covers everything students need to master logarithms step by step. ✔ Laws of Logarithms (Product, Quotient, Power) ✔ Simplifying Logarithmic Expressions ✔ Solving Logarithmic Equations ✔ Exam-Style Questions for Revision ✔ Clear Answer Keys Included ✔ Differentiated Worksheets (Easy → Advanced) Designed for busy teachers who need ready-to-use resources, these worksheets are ideal for: Lesson activities Homework assignments Test prep & revision Independent practice 💡 Why teachers love this resource: Saves planning time Engaging and structured questions Helps students improve exam performance fast 🎯 Perfect for: GCSE Maths, Algebra 2, High School Math Download now and give your students the practice they need to succeed in logarithms! tags: logarithm worksheets laws of logarithms worksheet logarithmic equations worksheet log rules practice algebra 2 logarithms GCSE logarithms revision solving logarithms worksheet log word problems math worksheets with answers exam style math questions high school math resources logarithm practice pdf
£39.00
Bundle
Logarithms Practice Worksheets Bundle | Differentiated Levels + Answer Keys
Boost your students’ confidence with this comprehensive Logarithm Worksheets Pack! Perfect for GCSE, Algebra 2, and high school math, this resource covers everything students need to master logarithms step by step. ✔ Laws of Logarithms (Product, Quotient, Power) ✔ Simplifying Logarithmic Expressions ✔ Solving Logarithmic Equations ✔ Exam-Style Questions for Revision ✔ Clear Answer Keys Included ✔ Differentiated Worksheets (Easy → Advanced) Designed for busy teachers who need ready-to-use resources, these worksheets are ideal for: Lesson activities Homework assignments Test prep & revision Independent practice 💡 Why teachers love this resource: Saves planning time Engaging and structured questions Helps students improve exam performance fast 🎯 Perfect for: GCSE Maths, Algebra 2, High School Math Perfect for: GCSE Maths, Algebra 2, High School Math Download now and give your students the practice they need to succeed in logarithms! tags: logarithm worksheets laws of logarithms worksheet logarithmic equations worksheet log rules practice algebra 2 logarithms GCSE logarithms revision solving logarithms worksheet log word problems math worksheets with answers exam style math questions high school math resources logarithm practice pdf
£40.00
Bundle
Logarithmic Equations Worksheets | Step-by-Step Practice + Solutions Included
Boost your students’ confidence with this comprehensive Logarithm Worksheets Pack! Perfect for GCSE, Algebra 2, and high school math, this resource covers everything students need to master logarithms step by step. ✔ Laws of Logarithms (Product, Quotient, Power) ✔ Simplifying Logarithmic Expressions ✔ Solving Logarithmic Equations ✔ Exam-Style Questions for Revision ✔ Clear Answer Keys Included ✔ Differentiated Worksheets (Easy → Advanced) Designed for busy teachers who need ready-to-use resources, these worksheets are ideal for: Lesson activities Homework assignments Test prep & revision Independent practice 💡 Why teachers love this resource: Saves planning time Engaging and structured questions Helps students improve exam performance fast 🎯 Perfect for: GCSE Maths, Algebra 2, High School Math Download now and give your students the practice they need to succeed in logarithms!
£25.00
Bundle
Logarithm Worksheets with Answers | Laws of Logarithms Practice + Exam Questions
Boost your students’ confidence with this comprehensive Logarithm Worksheets Pack! Perfect for GCSE, Algebra 2, and high school math, this resource covers everything students need to master logarithms step by step. ✔ Laws of Logarithms (Product, Quotient, Power) ✔ Simplifying Logarithmic Expressions ✔ Solving Logarithmic Equations ✔ Exam-Style Questions for Revision ✔ Clear Answer Keys Included ✔ Differentiated Worksheets (Easy → Advanced) Designed for busy teachers who need ready-to-use resources, these worksheets are ideal for: Lesson activities Homework assignments Test prep & revision Independent practice 💡 Why teachers love this resource: Saves planning time Engaging and structured questions Helps students improve exam performance fast 🎯 Perfect for: GCSE Maths, Algebra 2, High School Math Download now and give your students the practice they need to succeed in logarithms! tags: logarithm worksheets laws of logarithms worksheet logarithmic equations worksheet log rules practice algebra 2 logarithms GCSE logarithms revision solving logarithms worksheet log word problems math worksheets with answers exam style math questions high school math resources logarithm practice pdf
£13.00
Bundle
how do you graph parametric equations on desmos
how do you graph parametric equations on desmos hard a level logarithm questions logs a level questions logarithm advanced level questions logarithms a level maths questions aqa a level maths logarithms questions and answers logarithms a level edexcel questions logarithmic modelling a level maths questions exponentials and logarithms a level maths questions logarithms a level maths past paper questions
£9.00
Something went wrong, please try again later.
This resource hasn't been reviewed yet
To ensure quality for our reviews, only customers who have purchased this resource can review it
Report this resourceto let us know if it violates our terms and conditions.
Our customer service team will review your report and will be in touch.
£4.00