Types of Graphs | Direct InstructionQuick View
osmialearning

Types of Graphs | Direct Instruction

(0)
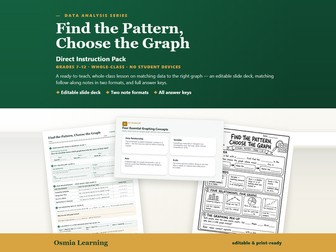
Teach graph selection directly to Grades 7–12 with this self-contained, no-device lesson. Students match data relationships to bar, line, circle, or scatter graphs and defend their choices. What is included Fully editable 16:9 PowerPoint slide deck with teacher notes (18 slides) Project-ready PDF version of the complete presentation Structured Guided Notes student packet Illustrated Visual Notes student packet Matching teacher answer keys for both note formats 3-page Direct Instruction Teacher Guide with pacing, common mix-ups, and grading guidance Terms of use Classroom use Project the editable deck for whole-class instruction while students complete either note format. Use the second format for differentiation, review, makeup work, or a substitute plan. The pack is complete for offline teaching; students name the data relationship, choose a graph, title it clearly, and defend the choice with evidence. Grades 7–12. Best fit for middle school science, biology, environmental science, and data-analysis units. Single-teacher license. © Osmia LLC. Related TES resources Types of Graphs | Bar, Line, Circle & Scatter Science Graphing Practice | Line, Bar, Circle & Scatter
Collecting & Organizing Data | Direct InstructionQuick View
osmialearning

Collecting & Organizing Data | Direct Instruction

(0)
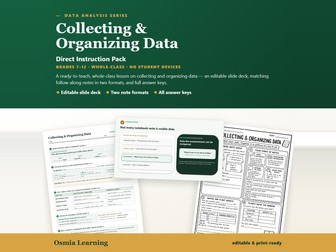
Teach students to collect and organize usable science data directly in Grades 7–12 with this self-contained, no-device lesson. Students distinguish measurements from opinions, build clear tables, and support claims with organized evidence. What is included Fully editable 16:9 PowerPoint slide deck with teacher notes (15 slides) Project-ready PDF version of the complete presentation Structured Guided Notes student packet Illustrated Visual Notes student packet Matching teacher answer keys for both note formats 3-page Direct Instruction Teacher Guide with pacing, common mix-ups, and grading guidance Terms of use Classroom use Project the editable deck for whole-class instruction while students complete either note format. Use the second format for differentiation, review, makeup work, or a substitute plan. The pack is complete for offline teaching; students apply a three-question data test, design clear tables, avoid the Biggest-Number Trap, and build a concise claim supported by organized evidence. Grades 7–12. Best fit for middle school science, biology, environmental science, and data-analysis units. Single-teacher license. © Osmia LLC. Related TES resources Collecting & Organizing Data | Full Lesson Science Graphing Practice | Line, Bar, Circle & Scatter
Repeat the Test | Direct InstructionQuick View
osmialearning

Repeat the Test | Direct Instruction

(0)
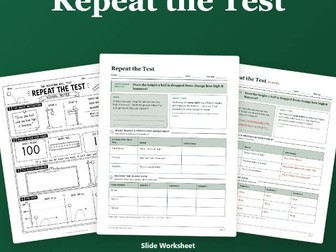
Teach replication and reliable evidence directly to Grades 7–12 with this self-contained, no-device lesson. Students plan repeatable procedures, run multiple trials, and interpret averages. What is included Fully editable 16:9 PowerPoint slide deck with teacher notes (9 slides) Project-ready PDF version of the complete presentation Structured Guided Notes student packet Illustrated Visual Notes student packet Standalone formative Exit Ticket with student page and teacher key Matching teacher answer keys for both note formats 3-page Direct Instruction Teacher Guide with pacing, common mix-ups, and grading guidance Terms of use Classroom use Project the editable deck for whole-class instruction while students complete either note format. Use the second format for differentiation, review, makeup work, or a substitute plan. The pack is complete for offline teaching and works well for grades 7–12 science, including biology, chemistry, environmental science, and scientific-practices units. Single-teacher license. © Osmia LLC. Related TES resources Repeat the Test | Reliable Data Full Lesson Variables & Fair Tests | Direct Instruction
Variables & Fair Tests | Direct InstructionQuick View
osmialearning

Variables & Fair Tests | Direct Instruction

(0)
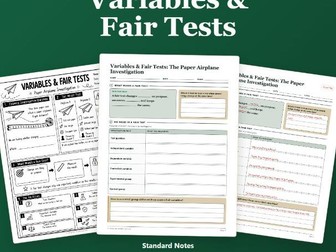
Teach variables and fair tests directly to Grades 7–12 with this self-contained, no-device lesson. Students identify independent, dependent, and controlled variables and redesign flawed investigations. What is included Fully editable 16:9 PowerPoint slide deck with teacher notes (12 slides) Project-ready PDF version of the complete presentation Structured Guided Notes student packet Illustrated Visual Notes student packet Standalone formative Exit Ticket with student page and teacher key Matching teacher answer keys for both note formats 3-page Direct Instruction Teacher Guide with pacing, common mix-ups, and grading guidance Terms of use Classroom use Project the editable deck for whole-class instruction while students complete either note format. Use the second format for differentiation, review, makeup work, or a substitute plan. The pack is complete for offline teaching and works well for grades 7–12 science, including biology, chemistry, environmental science, and scientific-practices units. Single-teacher license. © Osmia LLC. Related TES resources Variables & Fair Tests | Full Lesson Observation vs. Inference | Full Lesson
Observation vs. Inference | Direct InstructionQuick View
osmialearning

Observation vs. Inference | Direct Instruction

(0)
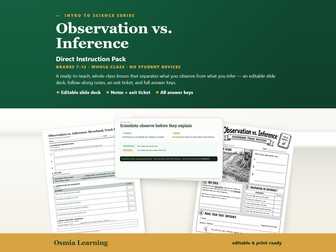
Teach observation vs. inference directly to Grades 7–12 with this self-contained, no-device lesson. Students record direct evidence, avoid premature claims, and revise inferences when new clues appear. What is included Fully editable 16:9 PowerPoint slide deck with teacher notes (9 slides) Project-ready PDF version of the complete presentation Structured Guided Notes student packet Illustrated Visual Notes student packet Standalone formative Exit Ticket with student page and teacher key Matching teacher answer keys for both note formats 3-page Direct Instruction Teacher Guide with pacing, common mix-ups, and grading guidance Terms of use Classroom use Project the editable deck for whole-class instruction while students complete either note format. Use the second format for differentiation, review, makeup work, or a substitute plan. The pack is complete for offline teaching and works well for grades 7–12 science, including biology, chemistry, environmental science, and scientific-practices units. Single-teacher license. © Osmia LLC. Related TES resources Observation vs. Inference | Full Lesson CER Practice Worksheet | Everyday Science + Answer Key
Reading Graphs & Charts | Direct InstructionQuick View
osmialearning

Reading Graphs & Charts | Direct Instruction

(0)
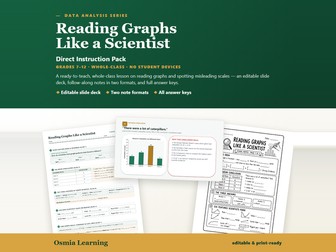
Teach Grades 7–12 students to read graphs critically with this self-contained, no-device lesson. Students annotate graphs, detect misleading scales, distinguish trend from causation, and write bounded CER conclusions. What is included Fully editable 16:9 PowerPoint slide deck with teacher notes (18 slides) Project-ready PDF version of the complete presentation Structured Guided Notes student packet Illustrated Visual Notes student packet Matching teacher answer keys for both note formats 3-page Direct Instruction Teacher Guide with pacing, common mix-ups, and grading guidance Terms of use Classroom use Project the editable deck for whole-class instruction while students complete either note format. Use the second format for differentiation, review, makeup work, or a substitute plan. The pack is complete for offline teaching; students learn to annotate graphs, detect truncated or misleading axes, distinguish trend from causation, repair vague statements, and build bounded CER conclusions supported by graph evidence. Grades 7–12. Best fit for middle school science, biology, environmental science, and data-analysis units. Single-teacher license. © Osmia LLC. Related TES resources Reading Graphs & Charts | Data Analysis Lesson Science Graphing Practice | Line, Bar, Circle & Scatter
Data Analysis: Multiple Datasets & CER | Direct LessonQuick View
osmialearning

Data Analysis: Multiple Datasets & CER | Direct Lesson

(0)
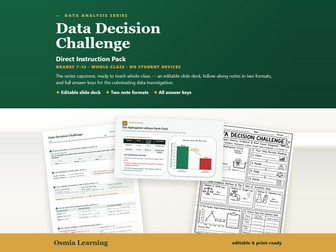
Teach evidence-based scientific decisions directly to Grades 7–12 with this self-contained, no-device lesson. Students analyze multiple datasets, investigate anomalies, evaluate competing explanations, and write a Decision Report. What is included Fully editable 16:9 PowerPoint slide deck with teacher notes (18 slides) Project-ready PDF version of the complete presentation Structured Guided Notes student packet Illustrated Visual Notes student packet Matching teacher answer keys for both note formats 3-page Direct Instruction Teacher Guide with pacing, common mix-ups, and grading guidance Terms of use Classroom use Project the editable deck for whole-class instruction while students complete either note format. Use the second format for differentiation, review, makeup work, or a substitute plan. The pack is complete for offline teaching; students use multiple evidence streams to diagnose a hydroponic lettuce crisis, critique competing proposals, and write a testable recommendation. Grades 7–12. Best fit for middle school science, biology, environmental science, and data-analysis units. Single-teacher license. © Osmia LLC. Related TES resources Data Analysis: Multiple Datasets & CER | Full Lesson Science Graphing Practice | Line, Bar, Circle & Scatter
Drawing Conclusions from Data | Direct InstructionQuick View
osmialearning

Drawing Conclusions from Data | Direct Instruction

(0)
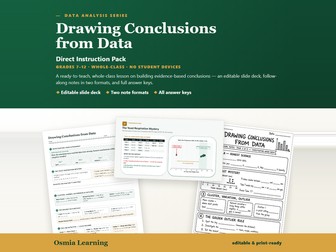
Teach evidence-based conclusions from data directly to Grades 7–12 with this self-contained, no-device lesson. Students investigate outliers, review procedural evidence, and write a bounded CER conclusion. What is included Fully editable 16:9 PowerPoint slide deck with teacher notes (18 slides) Project-ready PDF version of the complete presentation Structured Guided Notes student packet Illustrated Visual Notes student packet Matching teacher answer keys for both note formats 3-page Direct Instruction Teacher Guide with pacing, common mix-ups, and grading guidance Terms of use Classroom use Project the editable deck for whole-class instruction while students complete either note format. Use the second format for differentiation, review, makeup work, or a substitute plan. The pack is complete for offline teaching; students learn to read clusters and variation, investigate surprising outliers, distinguish biological variation from test errors, sort evidence, and write a bounded claim supported by data. Grades 7–12. Best fit for middle school science, biology, environmental science, and data-analysis units. Single-teacher license. © Osmia LLC. Related TES resources Drawing Conclusions from Data | Outliers & CER | Full Lesson CER Practice Worksheet | Everyday Science + Answer Key
Lab Safety | Direct InstructionQuick View
osmialearning

Lab Safety | Direct Instruction

(0)
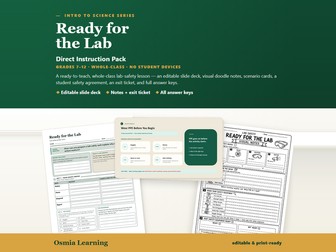
Teach lab safety directly to Grades 7–12 with this self-contained, no-device lesson. Students identify hazards, choose PPE, rehearse emergency responses, and apply a clear safety routine. What is included Fully editable 16:9 PowerPoint slide deck with teacher notes (11 slides) Project-ready PDF version of the complete presentation Structured Guided Notes student packet Illustrated Visual Notes student packet Six laboratory safety scenario cards Student Safety Agreement Standalone formative Exit Ticket with student page and teacher key Matching teacher answer keys for both note formats 3-page Direct Instruction Teacher Guide with pacing, common mix-ups, and grading guidance Terms of use Classroom use Project the editable deck for whole-class instruction while students complete either note format. Use the second format for differentiation, review, makeup work, or a substitute plan. The pack is complete for offline teaching and works well for grades 7–12 science, including biology, chemistry, environmental science, and scientific-practices units. Single-teacher license. © Osmia LLC. Related TES resources Lab Safety | Slides, Worksheets & Exit Ticket Variables & Fair Tests | Direct Instruction
CER: Claim, Evidence & Reasoning | Direct InstructionQuick View
osmialearning

CER: Claim, Evidence & Reasoning | Direct Instruction

(0)
Teach Claim–Evidence–Reasoning (CER) directly to Grades 7–12 with this self-contained, no-device lesson. Students extract measurements, separate claim from evidence and reasoning, and build a defensible explanation. What is included Fully editable 16:9 PowerPoint slide deck with teacher notes (12 slides) Project-ready PDF version of the complete presentation Structured Guided Notes student packet Illustrated Visual Notes student packet Standalone formative Exit Ticket with student page and teacher key Matching teacher answer keys for both note formats 3-page Direct Instruction Teacher Guide with pacing, common mix-ups, and grading guidance Terms of use Classroom use Project the editable deck for whole-class instruction while students complete either note format. Use the second format for differentiation, review, makeup work, or a substitute plan. The pack is complete for offline teaching and works well for grades 7–12 science, including biology, chemistry, environmental science, and scientific-practices units. Single-teacher license. © Osmia LLC. Related TES resources CER: Claim, Evidence & Reasoning | Full Lesson CER Practice Worksheet | Everyday Science + Answer Key
CER Practice Worksheet | Everyday Science + Answer KeyQuick View
osmialearning

CER Practice Worksheet | Everyday Science + Answer Key

(0)
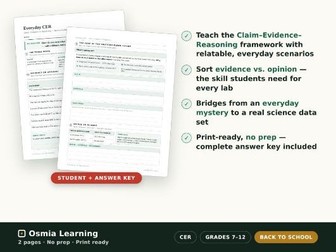
Build Claim–Evidence–Reasoning (CER) skills in Grades 7–12 with this independent science practice worksheet. Students separate evidence from opinion, solve an everyday mystery, and transfer the structure to real data. Before your first big lab, students need to know the difference between real evidence and a personal opinion, and how to reason from one to the other. This back-to-school worksheet teaches the Claim"Evidence"Reasoning (CER) framework using scenarios teenagers actually relate to, then transfers the exact same structure to a real science data set so the skill sticks. WHAT’S INCLUDED • The three parts of CER - Claim, Evidence, and Reasoning - in clear student language • An Evidence or Opinion? sorting table that drills objective evidence versus subjective judgment • The Case of the Shutting-Down Laptop - an everyday mystery students solve with a full written CER • A Bridge to Science task that applies CER to real dissolving-rate data • A complete, ready-to-grade answer key with model responses WHY TEACHERS USE IT • 100% no prep - just print and teach • Works in Biology, Chemistry, Physical Science, Environmental Science, or introductory science • Not tied to any specific unit - use it any time you introduce scientific argumentation • Mature, high-school-ready design and tone for grades 7"12 Formats: print-ready PDF student worksheet plus separate answer key. Recommended for grades 7"12. Terms of use: single-teacher license. © Osmia LLC. Related TES resources CER: Claim, Evidence & Reasoning | Full Lesson CER: Claim, Evidence & Reasoning | Direct Instruction
Science Graphing Practice | Line, Bar, Circle & ScatterQuick View
osmialearning

Science Graphing Practice | Line, Bar, Circle & Scatter
(0)
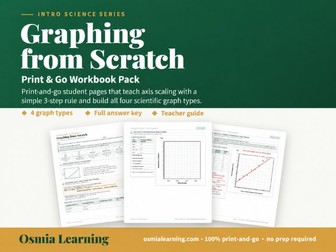
Give Grades 7–12 students print-and-go science graphing practice with this independent workbook. Students scale axes, choose graph types, plot line, bar, circle, and scatter graphs, interpret trends, and check their work with a rubric. What’s included 6-page student workbook with the TAILS checklist: Title, Axes, Intervals, Labels, and Scale. A 3-step axis-scaling rule with worked examples: find the maximum, divide by the boxes, and round up to a friendly counting number. A graph-choice matrix and a “Broken Graph” error-diagnostic audit. Four practice investigations: a line graph for continuous data, a bar graph for categorical data, a circle graph for atmospheric composition with a pre-divided percentage wheel, and a scatter plot with a line of best fit and prediction. 7-page answer key and teacher guide with complete model graphs, flexible 60–90 minute pacing, common student errors, and the TAILS Graphing Mastery Rubric. Classroom use 100% print-and-go: no lab prep, internet, or student accounts required. Use it as a back-to-school science-skills primer, a sub-day packet, or a graphing refresher before a lab. It fits Intro/Physical Science, Biology, and Chemistry. Students practice scaling axes, choosing graph types, plotting continuous and categorical data, labeling units, constructing circle graphs, drawing a line of best fit, interpreting trends, making predictions, and checking their work against a rubric. Single-teacher license. © Osmia LLC. Tes paid licence. Related TES resources Types of Graphs | Bar, Line, Circle & Scatter Types of Graphs | Direct Instruction