


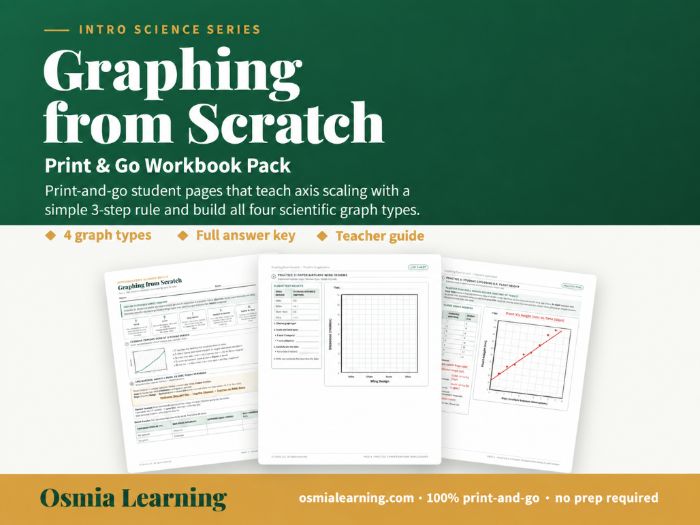

Give Grades 7–12 students print-and-go science graphing practice with this independent workbook. Students scale axes, choose graph types, plot line, bar, circle, and scatter graphs, interpret trends, and check their work with a rubric.
What’s included- 6-page student workbook with the TAILS checklist: Title, Axes, Intervals, Labels, and Scale.
- A 3-step axis-scaling rule with worked examples: find the maximum, divide by the boxes, and round up to a friendly counting number.
- A graph-choice matrix and a “Broken Graph” error-diagnostic audit.
- Four practice investigations: a line graph for continuous data, a bar graph for categorical data, a circle graph for atmospheric composition with a pre-divided percentage wheel, and a scatter plot with a line of best fit and prediction.
- 7-page answer key and teacher guide with complete model graphs, flexible 60–90 minute pacing, common student errors, and the TAILS Graphing Mastery Rubric.
100% print-and-go: no lab prep, internet, or student accounts required. Use it as a back-to-school science-skills primer, a sub-day packet, or a graphing refresher before a lab. It fits Intro/Physical Science, Biology, and Chemistry.
Students practice scaling axes, choosing graph types, plotting continuous and categorical data, labeling units, constructing circle graphs, drawing a line of best fit, interpreting trends, making predictions, and checking their work against a rubric.
Single-teacher license. © Osmia LLC. Tes paid licence.
Related TES resources
Something went wrong, please try again later.
This resource hasn't been reviewed yet
To ensure quality for our reviews, only customers who have purchased this resource can review it
Report this resourceto let us know if it violates our terms and conditions.
Our customer service team will review your report and will be in touch.
$3.00