**Algebra 2 logarithm domain , end behaviour ,asymptote,graphing practice,
**
logarithm domain and range
students determine domain, vertical and horizontal asymptotes
logarithmic derivatives practice- derivative sign chart
this resource covers:
how to find inflection points on a derivative graph
first derivative and second derivative graph
second derivative at point of inflection
the second derivative be can undefined at an inflection point
Logarithmic Functions Graphing – Step-by-Step Sketching, Domain, Asymptotes & End Behavior (Student-Friendly Guide)
This resource helps students understand and sketch logarithmic functions step by step, even at a basic or struggling level.
Students learn how to:
Identify the domain of logarithmic functions
Recognize vertical asymptotes
Determine if a graph goes up or down
Understand end behavior clearly
Compare logarithmic graphs with their inverse functions
**Graphing Logarithmic Functions | Comparing TI-84 Calculator and Desmos
**
This teaching resource allows students to compare the graphical behaviour of logarithmic functions using a graphing calculator and Desmos, encouraging mathematical reasoning and interpretation.
Through the function
f(x)=log(2x+6)
learners explore how different tools represent domain restrictions, asymptotes, and overall graph behaviour.
Students will:
Plot logarithmic functions using a calculator
Use Desmos for visual comparison
Identify where the function is defined
Explain differences between graphical outputs
Develop confidence in sketching by hand
Suitable for:
✔ Secondary mathematics
✔ GCSE higher tier
✔ A-Level preparation
✔ International curricula
✔ EAL / lower-attaining learners
Focuses on understanding and explanation, not just button-pressing.
logarithmic graphs, desmos maths, graphing logarithms, secondary maths functions, domain restrictions, asymptotes maths, calculator graphs, maths reasoning
Graphing Logarithmic Functions | Comparing TI-84 Calculator and Desmos
This teaching resource allows students to compare the graphical behaviour of logarithmic functions using a graphing calculator and Desmos, encouraging mathematical reasoning and interpretation.
Through the function
f(x)=log(sqrt(2x+6))
learners explore how different tools represent domain restrictions, asymptotes, and overall graph behaviour.
Students will:
Plot logarithmic functions using a calculator
Use Desmos for visual comparison
Identify where the function is defined
Explain differences between graphical outputs
Develop confidence in sketching by hand
Suitable for:
✔ Secondary mathematics
✔ GCSE higher tier
✔ A-Level preparation
✔ International curricula
✔ EAL / lower-attaining learners
Focuses on understanding and explanation, not just button-pressing.
logarithmic graphs, desmos maths, graphing logarithms, secondary maths functions, domain restrictions, asymptotes maths, calculator graphs, maths reasoning
Graphing Logarithmic Function, Domain , Asymptotes & end behaviour
Rational function inside logarithm + inverse function
nested logarithm
analysis of the function with detailed explanation
for exam preparation
properties of logarithms interactive & editable google slides
Attention Please: When you download the pdf you will find the link to google slides in the eleventh page of the pdf , you have two version printables and editable google slides
Help your students confidently master the Properties of Logarithms with this no-prep, digital math activity designed for high school math teachers around the world. This engaging and interactive Google Slides resource allows students to practice using the product rule, quotient rule, and power rule for logarithms with instant feedback and critical thinking opportunities.
Solving Logarithmic Equations using properties of logarithms Worksheet | 10 Practice Problems with Answer Key
What’s Included:
10 Logarithmic Equations (from basic to advanced)
Step-by-step solving (ideal for classwork, homework, or tutoring)
Printable worksheet (PDF)
Answer Key with clean formatting for quick reference
This teaching resource supports students in graphing logarithmic functions using a TI-84 calculator, with clear explanations and visual guidance.
It is suitable for secondary mathematics, including GCSE extension, A-Level, and international curricula.
Learners will:
Input logarithmic expressions accurately on a graphing calculator
Understand where the function is defined
Identify vertical asymptotes
Describe graph behaviour clearly
Use calculator output to sketch graphs correctly
This resource works well for:
✔ Classroom demonstrations
✔ Independent practice
✔ Revision and exam preparation
✔ Support and lower-ability groups
✔ ESL / EAL learners
The focus is on conceptual understanding, helping students move from calculator use to mathematical reasoning.
logarithmic graphs, graphing logarithmic functions, TI-84 calculator maths, secondary maths logarithms, asymptotes and domain, A level logarithms, sketching graphs maths, maths revision resource
This resource supports students in graphing logarithmic functions using Desmos, with a strong focus on mathematical understanding rather than button-pressing.
Through the function
f(x)=log(x²−4x+3)
learners explore how domain restrictions affect the graph and why logarithmic graphs can have separate branches.
Students will:
Use Desmos to plot logarithmic expressions
Identify where the function is defined
Locate vertical asymptotes
Describe graph behaviour clearly
Translate calculator output into accurate sketches
Suitable for:
✔ Secondary mathematics
✔ GCSE extension
✔ A-Level preparation
✔ International curricula
✔ EAL / lower-attaining learners
Clear, visual, and ideal for revision, demonstration, or independent learning.
logarithmic graphs, desmos maths, graphing logarithms, secondary maths functions, domain and asymptotes, sketching graphs, a level logarithms, maths revision
sketching logarithmic graphs ,logarithmic functions - graph , algebra 2
Logarithmic Functions Graphing – Step-by-Step Sketching, Domain, Asymptotes & End Behavior (Student-Friendly Guide)
This resource helps students understand and sketch logarithmic functions step by step, even at a basic or struggling level.
Logarithmic Functions Graphing – Step-by-Step Sketching, Domain, Asymptotes & End Behavior (Student-Friendly Guide)
This resource helps students understand and sketch logarithmic functions step by step, even at a basic or struggling level.
It includes clear explanations in simple language to analyze logarithmic graphs: number of branches, increasing or decreasing behavior, inverse functions, and end behavior.
sketching exponential , logarithm graph ks5
Logarithmic Functions Graphing – Step-by-Step Sketching, Domain, Asymptotes & End Behavior (Student-Friendly Guide)
This resource helps students understand and sketch logarithmic functions step by step, even at a basic or struggling level.
It includes clear explanations in simple language to analyze logarithmic graphs: number of branches, increasing or decreasing behavior, inverse functions, and end behavior.
This resource provides clear, step-by-step TI-84 instructions to help students graph and sketch logarithmic functions with confidence.
It is designed for high school math, Algebra 2, and Precalculus, with special attention to struggling students, ESL/FLS learners, and support classes.
Students learn how to:
Enter logarithmic functions correctly on a TI-84 calculator
Set an effective window to see the graph clearly
Identify the domain and vertical asymptotes
Recognize increasing and decreasing behavior
Sketch logarithmic graphs accurately from the calculator view
This resource includes:
✔ TI-84 button-by-button instructions
✔ Student-friendly explanations
✔ Support for calculator-based assessments
✔ Ideal material for guided practice, review, or remediation
Perfect for:
Algebra 2 & Precalculus classrooms
Graphing calculator lessons
Exam preparation and revision
Differentiated instruction
Special education and inclusion settings
This guide helps students move from calculator use to graph understanding, building both confidence and conceptual clarity with logarithmic functions.
logarithmic functions graphing, TI-84 logarithmic graphs, graphing logarithms calculator, logarithm domain and asymptotes, algebra 2 logarithmic functions, precalculus logarithms, sketching logarithmic graphs, math calculator guide, ESL math support, special education math
 Quick View
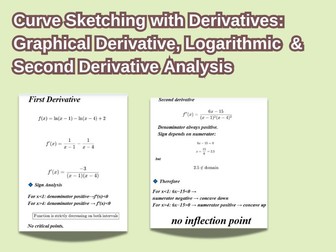 Quick View
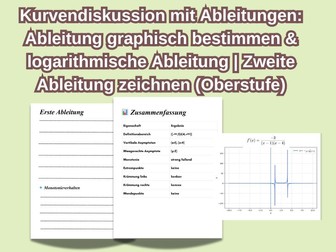 Quick View
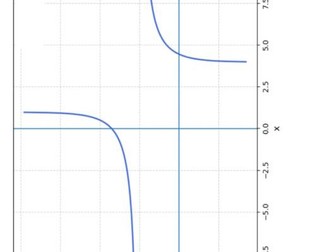 Quick View
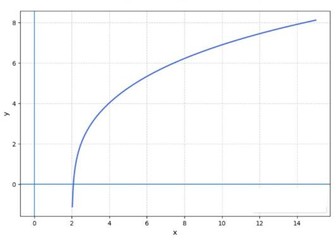 Quick View
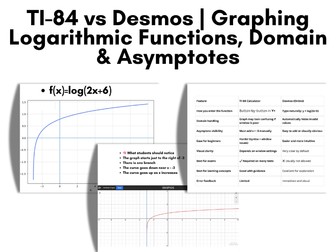 Quick View
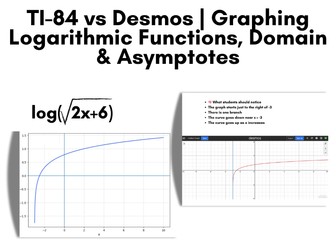 Quick View
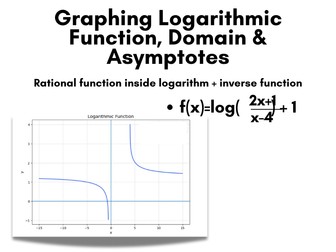 Quick View
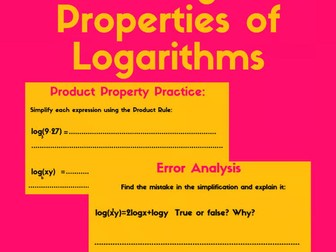 Quick View
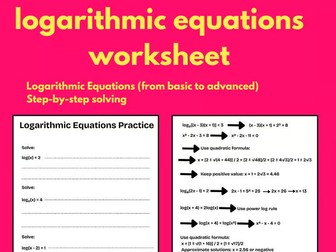 Quick View
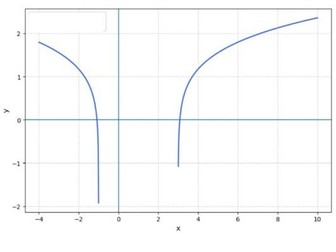 Quick View
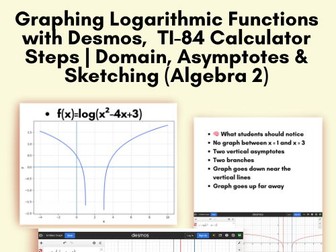 Quick View
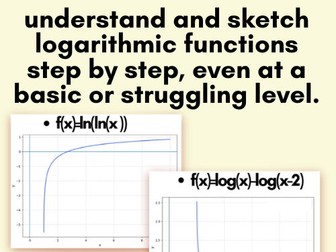 Quick View
 Quick View
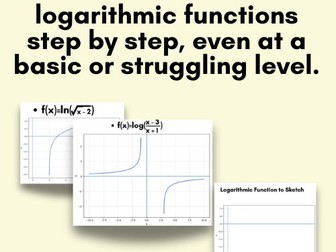 Quick View
 Quick View