220 multiple choice questions for A-level physics second year topics. These questions have carefully presented student-friendly model solutions.
Questions from the circular motion topic are available as a free sample
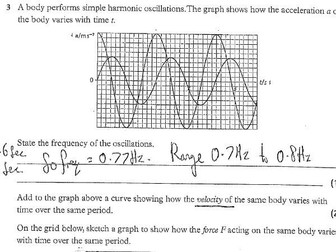
Collection of A-Level Physics exam questions on the topic of Oscillations (Simple Harmonic Motion). This pack contains questions and worked full solutions showing all steps. This can be used by teachers as a “walking-talking mock (WTM)”. This pack is a mixture of questions from the following exam boards: Edexcel (+ Edexcel International), AQA, OCR and Eduqas. The total number of marks for these questions is 36 marks.
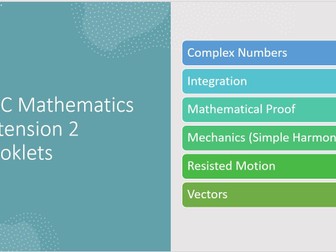
A booklet for the Mathematics Extension 2 topic of Mechanics. Content includes,
* Velocity and acceleration as functions of x
* Forces and acceleration
* Simple harmonic motion and time
* Simple harmonic motion and displacement
* SHM : Velocity as a function of displacement
20 SHM multiple choice questions for Physics A-level with student-friendly solutions.
Questions from the circular motion topic are available as a free sample
Also available 220 multiple choice question bundle for A-level physics second year topics
This allows students to practice finding the equation of trigonometric functions from the given graphs. The worksheet starts with equations of the form y = af(bx) and builds up to the general case y = af(b(x-c) + d. The first sheet's graphs are in degrees and are a mixture of sine and cosine. The second sheet's graphs are a mixture of trig graphs in radians and transformations of y = e^x and y = x^2. Especially useful for IB standard Level - which often asks this kind of question.
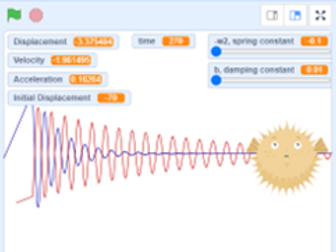
Use Scratch block-based programing to build a model of an oscillating puffer fish and investigate damped simple harmonic motion.
Instruction sheet for pupils that guides them through building and adjusting their model.
Question sheet for students to investigate how initial displacement, frequency and damping constant affect SHM.
Full code and answer sheet for teachers.
scratch.mit.edu/projects/414245392
Scratch is a free software online that is very easy to use. Building a model themselves helps the students to really think and understand what is actually going on.
Simple harmonic motion, damping, damped, oscillations, oscillation, SHM, frequency, spring constant
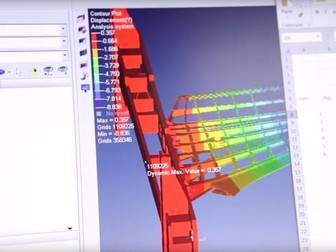
A 2 min video clip explaining how we test the fin of a 1000mph car.
BLOODHOUND’s giant tail fin is a key part of the car. It keeps it running straight and true. At 1,000mph it will see incredible loads, so the engineers need to monitor the aluminium structure using strain gauges…
The BLOODHOUND Project is not only about building a car to go 1,000mph, but it is also a perfect vehicle for education of STEM subjects. Over the life of this project we’ve been able to inspire over 2 million young people!
For more activities, videos, resources and information on workshops visit, www.bloodhoundssc.com, or follow us on twitter: @Bloodhound_EDU.
* GCSE, IGCSE, AP, PSAT, and IB - Exam Style Questions which covers all the related concepts required for students to unravel any International Exam Style trigonometric graphs Questions
* Learner will be able to say authoritatively that:
I can complete any question on how to determine the parameter for a given graph of a trigonometric function
Sketch or complete the graph for any given sine function
Sketch or complete the graph for any given cosine function
Sketch or complete the graph for any given tangent function
Understand the real-life applications of graph of a trigonometric function
Why do we need to know what trigonometric graphs look like?
• Trigonometric Graphs are used in various applications of mathematics – for example, the oscillating nature can be used to model how a pendulum swings
Drawing graphs – trig graphs
• As with other graphs, being familiar with the general style of trigonometric graphs will help you sketch them quickly and you can then use them to find values or angles alongside your calculator
• All trigonometric graphs follow a pattern – a “starting point” and then “something happens every 90°”.
 Quick View