 Quick ViewQuick View
 Quick View
mathematical concept of indices
mathematical concept of indices, explaining that powers serve as a convenient shorthand for repeated multiplication. It clearly defines the two key components of index notation: the base (the number being multiplied) and the index or power (indicating how many times the base is multiplied by itself).
The text also demonstrates how these laws apply to both whole numbers and fractions, showing examples of rewriting repeated multiplication using index notation and simplifying fractional powers.
Ultimately, this section’s purpose is to establish the fundamental rules and terminology of index laws through learning objectives, definitions, and practical examples.
 Quick View
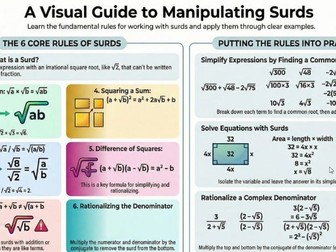
GCSE Surds Tutorial
This educational material focuses on the procedures for Manipulating Surds, which are defined as expressions with irrational square roots that cannot be simply written as fractions. The text presents six essential rules for working with surds, covering operations like multiplication, division, and how binomial expressions involving surds are expanded. A key concept introduced is ‘Rationalising the denominator’, which is the process of eliminating the surd from the bottom of a fraction to simplify the expression. Finally, the resource provides several examples demonstrating how to Use the Rules to Simplify Expressions, applying these algebraic principles to solve problems such as simplifying a sum of surds or solving for the dimensions of a rectangle.
 Quick View
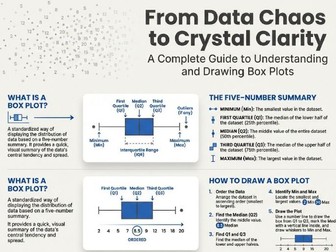
GCSE Maths Master Bounds
GCSE Maths Master Bounds 19 pages PDF
This document offers a detailed guide to understanding and constructing Box Plots, which are effective visual summaries of a data set’s spread. These plots illustrate five key values: the minimum and maximum data points, along with the three quartiles ($Q1$, $Q2$, and $Q3$), representing the $25%$, $50%$ (median), and $75%$ marks of the ordered data. The text emphasizes that box plots reveal two measures of spread—the range and the more reliable Interquartile Range (IQR), which is the difference between $Q3$ and $Q1$ and encompasses the middle $50%$ of the data, making it less susceptible to outliers. Ultimately, the purpose of a box plot is to present a quick, informative overview of data distribution, although it does not provide the total number of individual data points.
 Quick View
Mastering Dynamic Ratio
Master the process of changing between ratios when the quantities involved are altered.
The core objective is demonstrated through a detailed example that illustrates how to calculate a new ratio after one or both parts of the original ratio have been changed, such as when objects are bought, sold, or added.
Furthermore, the document includes a series of exercises that require the student to apply these principles to various word problems, ensuring they can simplify ratios and determine new quantitative relationships in practical scenarios.
Ultimately, the purpose is to teach students how to maintain proportionality and accurately express new relationships using ratio notation.
undefined
Mastering Percentage Change
This pdf focuses on the mathematical concepts of Percentage Increase and Decrease, outlining a fundamental procedure for calculating an amount after it has been adjusted by a percentage.
The learning objective—to be able to find amounts following a percentage change—and illustrates the method with a worked example showing how to add or subtract the calculated percentage from the original amount.
.
 Quick View