 Quick View
IB Physics (2025-) - Microsoft Excel skills tutorial for students to plot graphs
I have found that my IB physics students do not know how to use Microsoft Excel well in order to plot graphs of their data in their internal assessment.
I created this tutorial for my students to walk them through plotting graphs.
This includes:
basics: how to add a title / how to add minor gridlines / how to add a line of best fit
how to format your trend line to ensure students extrapolate their trend line through the y axis & show the equation of the line
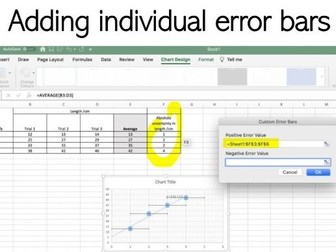
how to add custom individual error bars on each data point
how to add worst fit lines that pass through the error bars