Year 6: Interpret pie charts
1 session on PPT on how to interpret pie charts. Includes printable maths mastery resources progressing through: Fluency, Reasoning and Problem solving progression activities on slides.
 Quick View
 Quick View
 Quick View
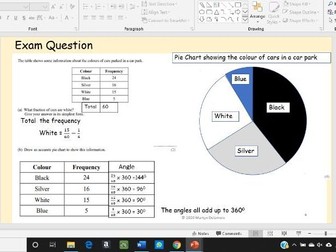 Quick View
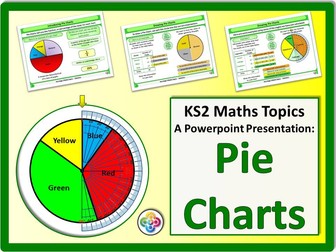 Quick View
 Quick View
 Quick View
 Quick View
 Quick View
 Quick View
 Quick View