KS3 (Ages 11-14) Algebra - Code Breaking WorksheetQuick View
mooogmooog

KS3 (Ages 11-14) Algebra - Code Breaking Worksheet

(21)
KS3 (11-14 year olds) Algebra Worksheet for practicing positive integer substitution into expressions. Three encoded messages. Decoding is easy, Letters can have values too, Some of the expressions are quite tricky you must concentrate building in difficulty. WIP sheet of expressions to use</p>
Finding Centres of RotationQuick View
mooogmooog

Finding Centres of Rotation

(20)
PowerPoint and worksheet to find the centre of rotation for a selection of different rotations. includes 90 degree and 180 degree
Direct Proportion Tables and GraphsQuick View
mooogmooog

Direct Proportion Tables and Graphs

(12)
Objectives: Spotting variables which are in direct proportion from a table of values. Plotting these values onto a set of axes, to identify the link to a straight line graph passing through the origin. Make the connection between the gradient of the graph and the constant of proportionality Worksheet and solutions
Identifying Angles between Parallel Lines. GameQuick View
mooogmooog

Identifying Angles between Parallel Lines. Game

(15)
Power Points show to be used with Individual White Boards for pupils to identify Vertically Opposite, Corresponding, Alternate and Interior Angles. It can be used as an assemssment tool for plenary or starter activity.It's well plan and well disagn help for lesson planning
Conversion GraphsQuick View
mooogmooog

Conversion Graphs

(13)
Worksheet and Turning Point Voting Pad ready PowerPoint. First section should be attempted untaught. Then the same questions are repeated post teaching to demonstrate progress (the TurningPoint scores are adjusted so the first batch appears as the units, and the 2nd batch as the tens - to separate and demonstrate progress). From there on in the questions match the worksheet.
Area of a Parallelogram InvestigationQuick View
mooogmooog

Area of a Parallelogram Investigation

(13)
Invesigation into the area of a parallelogram. Measure the sides and the height (on cm squares) and count squares to find the area thereby deduce the formula for the area.
Which Graph is BestQuick View
mooogmooog

Which Graph is Best

(5)
4 sets of data with each represented as a line graph a bar chart and a pie chart. Students to identify good and bad aspects of each representation and decide which is the best one for the type of data shown.
Horse Race ProbabilityQuick View
mooogmooog

Horse Race Probability

(3)
Suitable for high ability KS2 students all the way up to GCSE, this is an interactive version of the classic two dice horse race problem. You can use the interactive dice on the right, and also the horse images in the table can be moved from cell to cell to demonstrate the method.
ConstructionsQuick View
mooogmooog

Constructions

(3)
Goes through the techniques of the perpendicular bisector (including through a specific point) and angle bisector. Details technique only, not reasoning behind why the construction works.
Practice Plotting Linear GraphsQuick View
mooogmooog

Practice Plotting Linear Graphs

(2)
4 sheets of similar difficulty, plotting 6 linear graphs onto the same coordinate axes. Each set of 6 graphs has the same y intercept. Could give different sheet to each student in a group to prompt questions. What's the same about your graphs? What's different about them? Can you see the similarities and differences represented in the equation?
Fractional Indices QuizQuick View
mooogmooog

Fractional Indices Quiz

(1)
Turning Point Voting Pad ready - but can be used with personal whiteboards. 8 questions on fractional powers.
Angle Bisector InstructionsQuick View
mooogmooog

Angle Bisector Instructions

(0)
Arrange the instructions in order. There is a white rectangle on the right hand side which if you move it out will reveal the word PERFECTION (if the instructions have been correctly ordered)
Percentage of Amount BubblesQuick View
mooogmooog

Percentage of Amount Bubbles

(0)
Complete the bubbles that match a percentage to an amount. 3 similar sheets - one with a fixed starting value and specified percentages to find. Students should complete the missing values and add arrows to show the operations they applied to known percentages to find the missing values. 2nd sheet leaves the choice of the 100% value open. 3rd sheet specifies connections but neither percentages nor starting value.
Creating SymmetriesQuick View
mooogmooog

Creating Symmetries

(0)
Complete diagrams to create the required lines of symmetry and order of rotational symmetry. symmetry, rotational symmetry, line symmetry
Income Tax CalculatorQuick View
mooogmooog

Income Tax Calculator

(2)
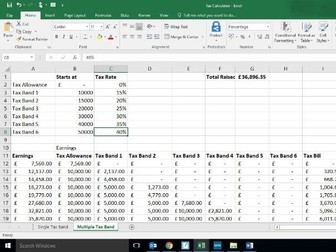
Spreadsheet for calculating income tax with either a single tax band (and tax free allowance) or up to 6 separate tax bands each with their own percentage rate. Useful for investigating the effect of different tax structures.
Hopping Mad InvestigationQuick View
mooogmooog

Hopping Mad Investigation

(0)
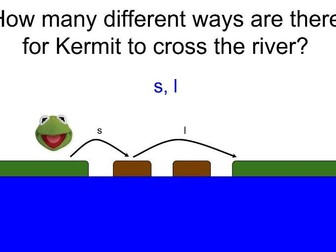
Mathematics investigation lesson based on the Hopping Mad number investigation from New York Cop. Find the different combination of hopping patterns for a frog to cross a river with varying numbers of hopping stones. Uncovers the Fibonacci sequence and justifies its applicability. Extension to a third hopping mechanism. Includes worksheet and supporting PowerPoint presentation.
Relative Frequency and Biased DiceQuick View
mooogmooog

Relative Frequency and Biased Dice

(0)
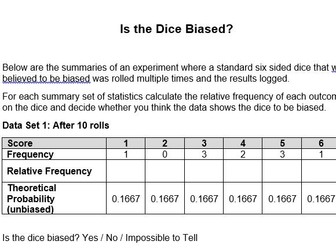
Data from simulated throws of a dice at 10, 50, 100, 500, 5000 and 50000 throws. Calculation of relative frequency for each data set and comparison against null hypothesis of an unbiased dice. Useful practice calculating relative frequency and prompting discussion over reliability of data. All answers supplied along with the probabilities used on the virtual dice.