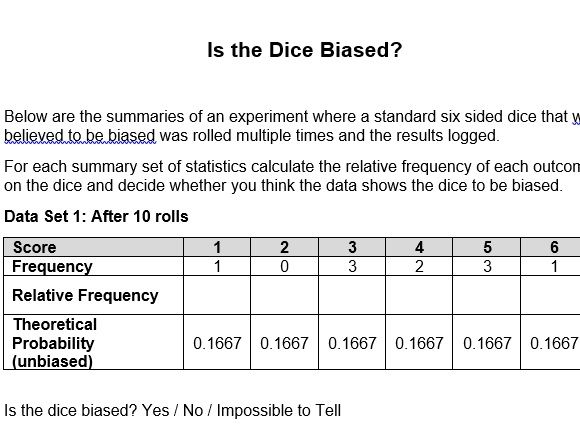

Data from simulated throws of a dice at 10, 50, 100, 500, 5000 and 50000 throws.
Calculation of relative frequency for each data set and comparison against null hypothesis of an unbiased dice.
Useful practice calculating relative frequency and prompting discussion over reliability of data.
All answers supplied along with the probabilities used on the virtual dice.
Something went wrong, please try again later.
This resource hasn't been reviewed yet
To ensure quality for our reviews, only customers who have downloaded this resource can review it
Report this resourceto let us know if it violates our terms and conditions.
Our customer service team will review your report and will be in touch.
£0.00