


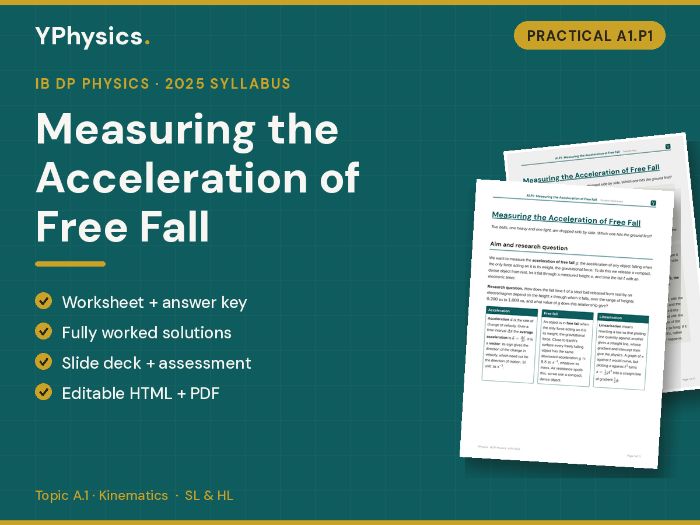
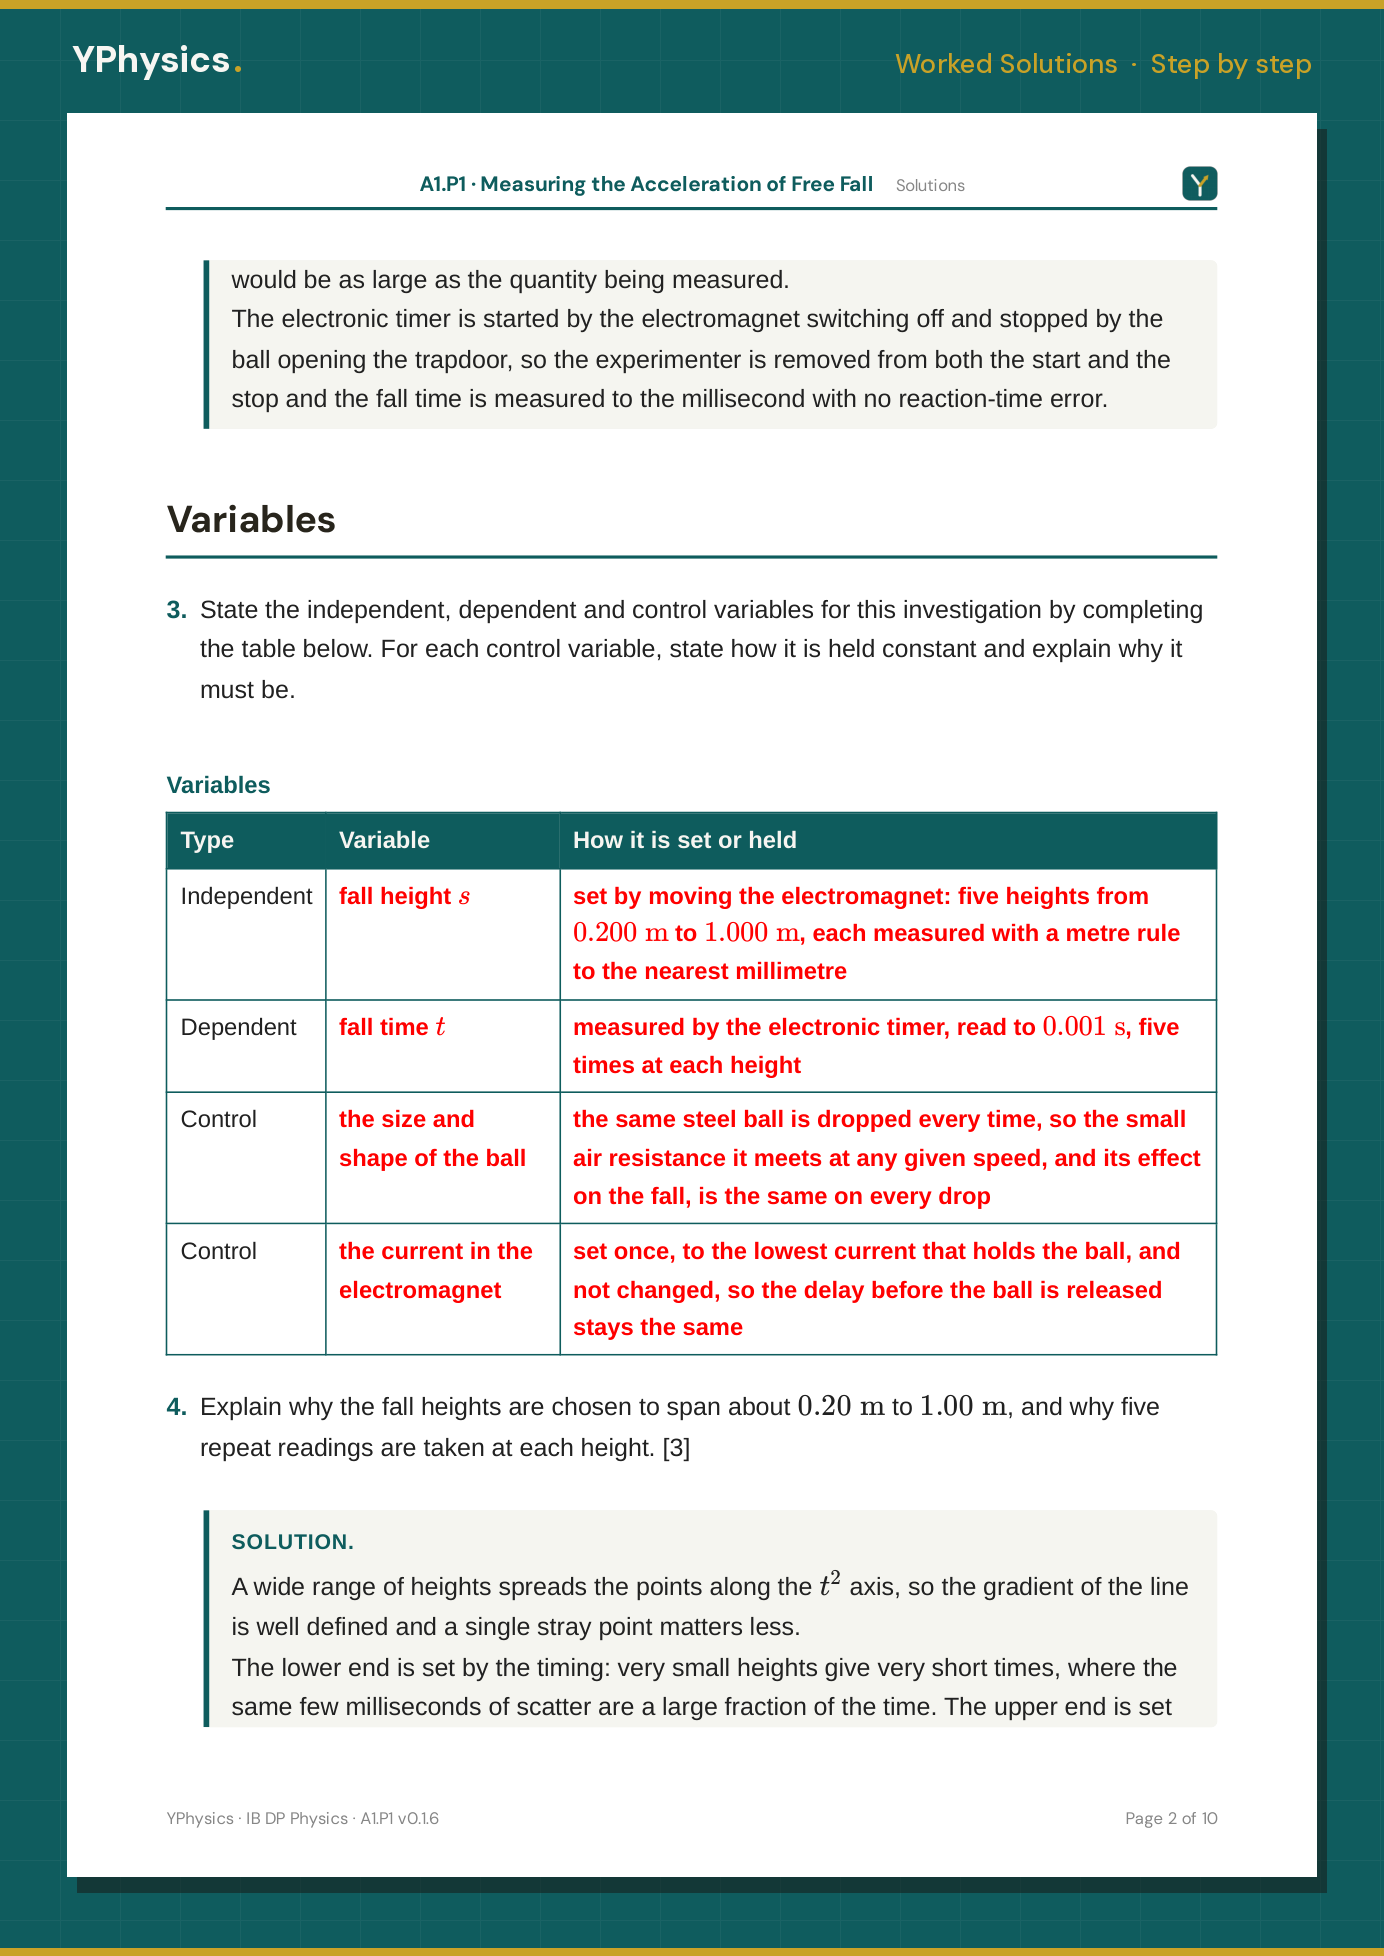
A complete IB DP Physics hands-on practical for Topic A.1 Kinematics, SL and HL, first assessment 2025, offered free as a full-quality sample of the premium catalogue: students measure the acceleration of free fall, g, by timing a steel ball falling from rest through a range of heights, then linearise s = ½gt² and read g from the gradient of an s-against-t² graph. Not a cut-down teaser but the complete practical, nothing watermarked.
This is a structured IB Inquiry lab worksheet, not an expository lesson. Students time repeat falls on an electronic millisecond timer, carry the extreme gradient lines to the axes to test whether the graph passes through the origin, compare g with the data booklet’s 9.8 m s⁻² by setting percentage error against percentage uncertainty, and size and rank each systematic error.
IB skills span Tool 1: Experimental techniques, Tool 2: Technology, Tool 3: Mathematics and the Inquiry cycle:
- Taught: measuring time and length; recording and propagating uncertainties; linearising; uncertainty bars and maximum and minimum gradient lines; the impact of uncertainties on a conclusion; sources of random and systematic error.
- Practised: safety, ethical and environmental issues; using sensors; predictions; justifying the variables and the range of readings; collecting and processing data; plotting and the line of best fit; reading the gradient and intercepts, and their uncertainty; percentage error and uncertainty; justifying a conclusion against the research question and the accepted value; realistic improvements.
What’s included:
- Student Worksheet - 12 pages, answers stripped
- Teacher Key - 17 pages, every answer, the model data, pacing and marking notes
- Worked Solutions - 10 pages, with the model graph
- Assessment - 8 pages, a questions-only write-up copy with mark allocations
- Lesson deck - 36 slides, staged reveals for the prediction, the processing and the graph
This is a skills practical, so it teaches no new IB understanding. Paced for a 90-minute double period, with three planning questions set as pre-lab homework and the write-up as homework after. Worksheet and deck open in any browser with nothing to install, and the worksheet is fully editable, so the data and heights adapt to your class. Suitable for grades 11-12 (ages 16-19).
Related resources:
- SUVAT Equations II: Vertical Motion and Gravity, the physics being measured
- Uncertainties on a Graph, the construction this lab asks for
- Uncertainties, the arithmetic behind the processed columns
Updated 22 Oct 2026: please reprint.
A rating helps other teachers find this.
Something went wrong, please try again later.
This resource hasn't been reviewed yet
To ensure quality for our reviews, only customers who have downloaded this resource can review it
Report this resourceto let us know if it violates our terms and conditions.
Our customer service team will review your report and will be in touch.
£0.00