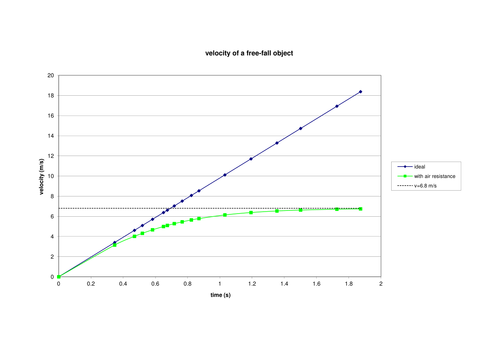


Experimental and modelled data of a falling shuttlecock to demonstrate terminal velocity. One graph shows the actual velocity-time graph compared with the ideal (no air resistance) and the other shows the distance-time graph from the experimental data.
Something went wrong, please try again later.
This resource hasn't been reviewed yet
To ensure quality for our reviews, only customers who have downloaded this resource can review it
Report this resourceto let us know if it violates our terms and conditions.
Our customer service team will review your report and will be in touch.
$0.00