Last updated
24 July 2016
Share this
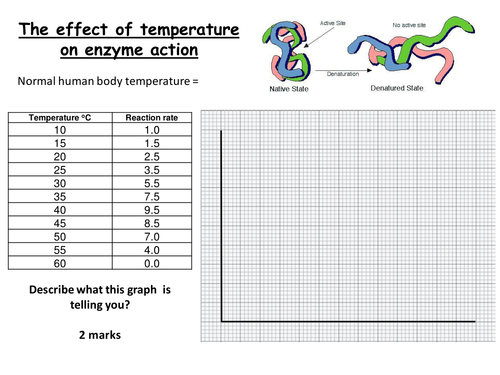
Pupils plot the graphs and then explain what the graph is telling them about the effect of temperature and pH on enzyme action.
Creative Commons "Sharealike"Select overall rating(no rating)
Your rating is required to reflect your happiness.
It's good to leave some feedback.
Something went wrong, please try again later.
Absolutely perfect in this climate of not being able to do practicals! Thank you so much.
Empty reply does not make any sense for the end user
Excellent resources as there are not many for plotting graphs for enzymes<br />
Thanks
Empty reply does not make any sense for the end user
Thank you, this is a big help!
Empty reply does not make any sense for the end user
Empty reply does not make any sense for the end user
A very useful resource, many thanks
Empty reply does not make any sense for the end user
Report this resourceto let us know if it violates our terms and conditions.
Our customer service team will review your report and will be in touch.