


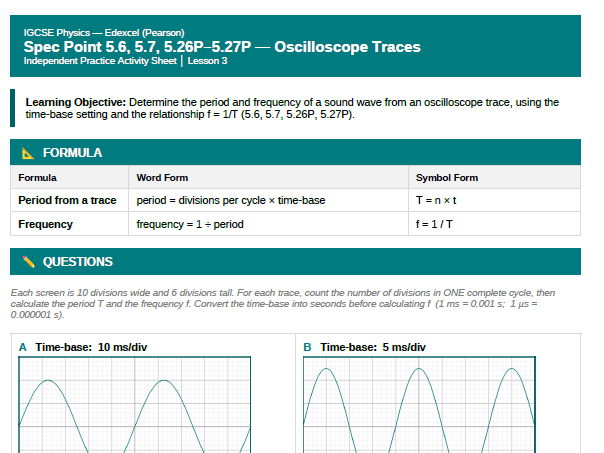
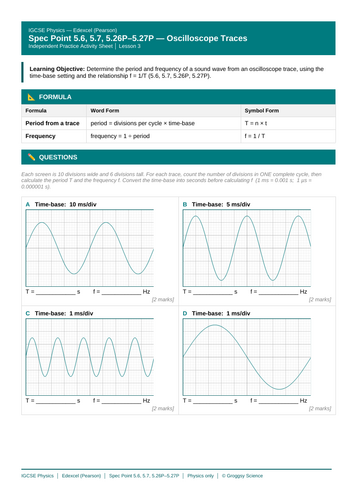
A free print-ready worksheet covering spec points 5.6, 5.7, 5.26P and 5.27P — using an oscilloscope trace and the time-base setting to determine the period and frequency of a sound wave.
Students consistently lose marks here by counting peaks instead of divisions per cycle, or by forgetting to convert the time-base into seconds. This worksheet drills both, using nine purpose-drawn oscilloscope screens rather than generic sine curves.
Worksheet includes:
Formula box: T = n × t and f = 1 / T
Nine oscilloscope traces (A–H plus a stretch), each drawn on a proper 10 × 6 division screen with minor gridlines, and each with its own time-base setting and answer lines
A deliberate difficulty progression — whole-division reads, a trace showing five cycles, a trace showing only one cycle, a half-division read, and two microsecond time-bases
Stretch question requiring frequency, then wavelength using v = fλ, then a judgement on whether the sound falls inside the 20 Hz – 20 000 Hz audible range
Full mark scheme with method marks shown for every trace
23 marks total, two pages of questions plus a separate mark scheme page
Answers range from 20 Hz to 25 kHz, so no two traces share a value — useful if you want students comparing work.
Specification: Edexcel International GCSE Physics (Modular) — Unit 5: Waves, spec points 5.6, 5.7, 5.26P–5.27P (Physics only)
Year group: Year 10 / Year 11
Also suitable for: AQA, OCR and Cambridge IGCSE sound and waves topics — the skill is identical across boards.
Something went wrong, please try again later.
This resource hasn't been reviewed yet
To ensure quality for our reviews, only customers who have downloaded this resource can review it
Report this resourceto let us know if it violates our terms and conditions.
Our customer service team will review your report and will be in touch.
£0.00