
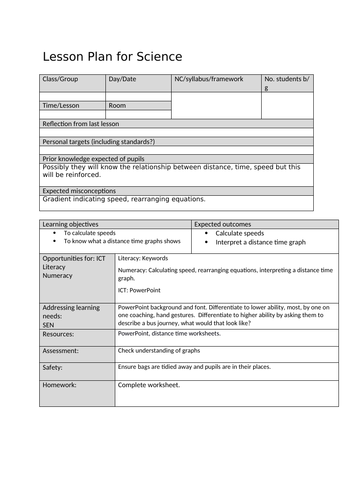
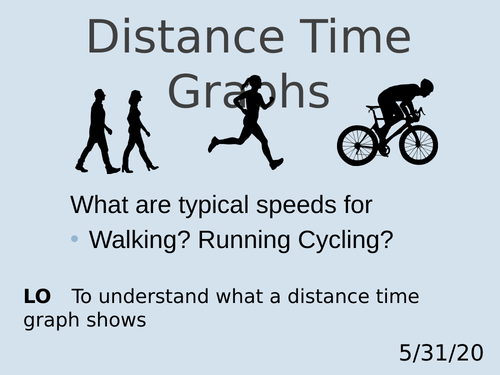
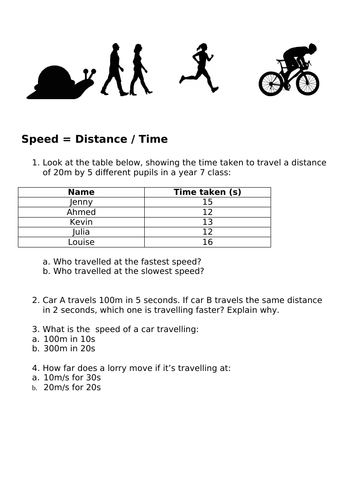
This is a complete lesson on distance time graphs I prepared for a Y7 class. Start by deciding who walks fastest from a data table which then introduces the idea of speed = distance / time (m/s) Some worked examples and then onto distance-time graphs: what is involved (axes, labels, origin, data etc) and then onto gradients and how they help us visualise speed. Finishing off with describing a journey using a graph.
Includes a PowerPoint, Lesson Plan and Work Sheet.
If you find this resource useful then it would be great if you could leave me a review
Something went wrong, please try again later.
This resource hasn't been reviewed yet
To ensure quality for our reviews, only customers who have downloaded this resource can review it
Report this resourceto let us know if it violates our terms and conditions.
Our customer service team will review your report and will be in touch.
£0.00