
NEW for 2026: Science skills programme for key stage 4.
Higher
KS3
…
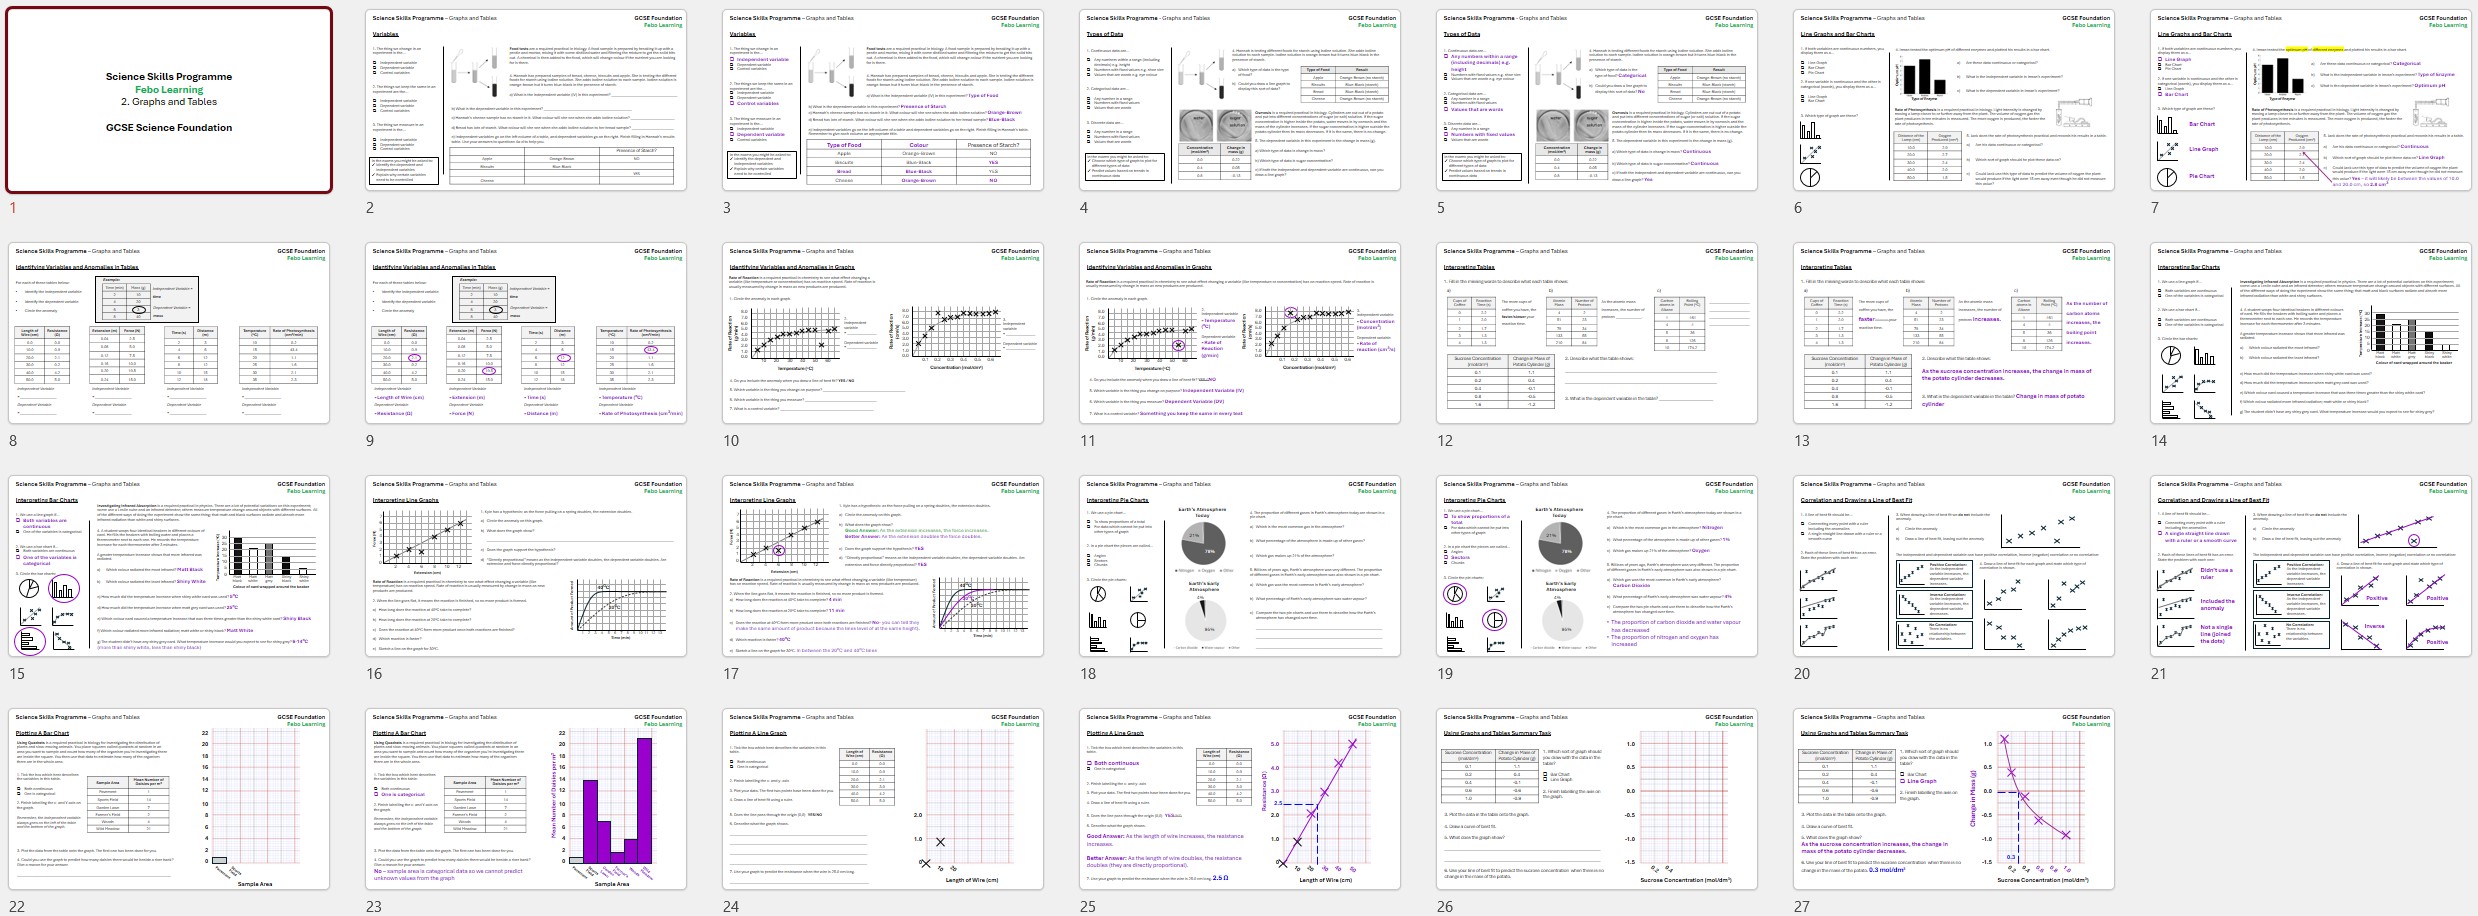
A series of thirteen short activities (with self-assessment slides) designed to give students the opportunity to refresh and practice their general science skills using examples from the GCSE required practicals. These can be delivered in lessons or as homework and are a great way to demonstrate that you are actively working to develop their fluency and scientific literacy.
…
- Variables
- Types of data
- Line graphs and bar charts
- Identifying variables and anomalies in tables
- Identifying variables and anomalies in graphs
- Interpreting tables
- Interpreting bar charts
- Interpreting line graphs
- Interpreting pie charts
- Correlation and drawing a line of best fit
- Plotting a bar chart
- Plotting a line graph
- Using graphs and tables summary task
… - All aspects of the sheets are fully editable
- Can be printed in gray scale
- Answer slides are included to allow students to self-assess
- The questions use examples from the required practicals, however they are for developing math skills and prior knowledge of the practical is not needed
…
More from our science skills programme: - Key Stage 3
- Higher GCSE
Something went wrong, please try again later.
We are pleased to let you know that your resource Science Skills Foundation GCSE: Graphs and Tables, has been hand-picked by the Tes resources content team to be featured in https://www.tes.com/teaching-resources/blog/maths-skills-science in February 2026 on https://www.tes.com/teaching-resources/blog. Congratulations on your resource being chosen and thank you for your ongoing contributions to the Tes Resources marketplace.
Report this resourceto let us know if it violates our terms and conditions.
Our customer service team will review your report and will be in touch.
£0.00