
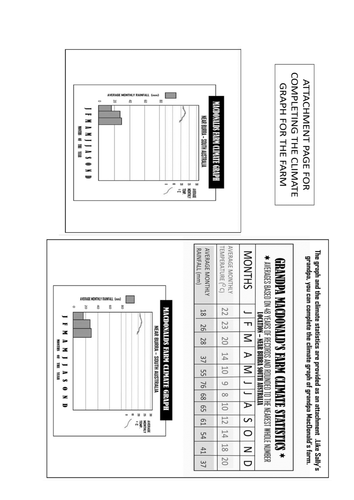
Climate graphs are often a starting point for location studies. This unit shows how to prepare a climate graph (of grandpa MacDonald's Farm) It's a step by step process and Sally has been very kind to her grandpa because she has gathered the figures; averaged the figures; set up the axes and labelled them. She has even provided a heading and completed the first 3 months of graphing. Grandpa MacDonald (and the students) are required to complete the graph. The attachments provide the basics of hard copies for distribution and the possibility of adding seasonal activities to the completed climate graph add challenge. Thanks to Sally, students should be able to construct climate graphs from statistics when they have completed this activity
Something went wrong, please try again later.
This resource hasn't been reviewed yet
To ensure quality for our reviews, only customers who have downloaded this resource can review it
Report this resourceto let us know if it violates our terms and conditions.
Our customer service team will review your report and will be in touch.
£0.00