
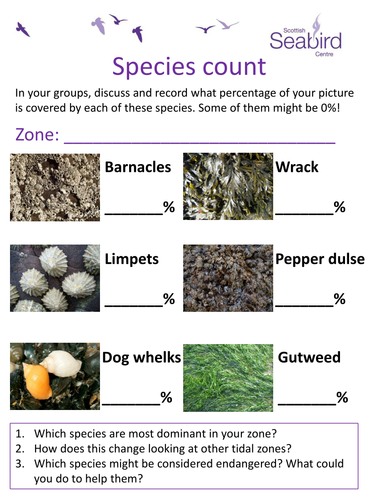
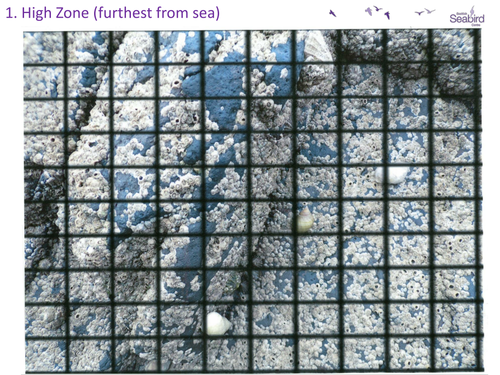

Using this resource, pupils are able to learn how ecologists and conservationists carry out surveys on rockpools to find out their level of biodiversity. In groups, pupils can look at a different rockpool tidal zone and decide, using the overlaid quadrat, what percentage of their area is covered with each of six different species. They can then compare with other groups to see how species distributions change from one zone to the next! Pupils can also use the attached graph template to show how the distribution of species changes as you move from the high zone to the low zone.
Something went wrong, please try again later.
This resource hasn't been reviewed yet
To ensure quality for our reviews, only customers who have downloaded this resource can review it
Report this resourceto let us know if it violates our terms and conditions.
Our customer service team will review your report and will be in touch.
£0.00