


This is an interactive Geogebra page. You can use it without downloading anything here.
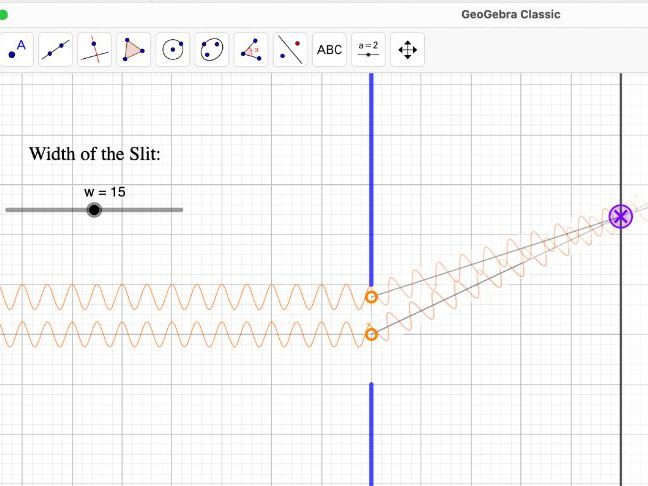
Click and drag the purple X up and down on the screen. You can show how at some positions the peaks and troughs of the sine waves line up as constructive interference, to make bright patches, and in other places the peaks and troughs are out of phase, so destructive interference means that these points are dark.
By making the slit smaller you can demonstrate how you need to move the cross further away from the centre to get a dark patch, showing how the diffraction angle is greater.
Please get in touch with me if you have more suggestions for how to use this tool, or write me a review if you like it.
Something went wrong, please try again later.
This resource hasn't been reviewed yet
To ensure quality for our reviews, only customers who have downloaded this resource can review it
Report this resourceto let us know if it violates our terms and conditions.
Our customer service team will review your report and will be in touch.
£0.00