


Designed for the AQA GCSE 9-1 specification. I teach the topic over two lessons to unsure a full understanding. Lesson objectives include
Understand how to measure velocity changes.
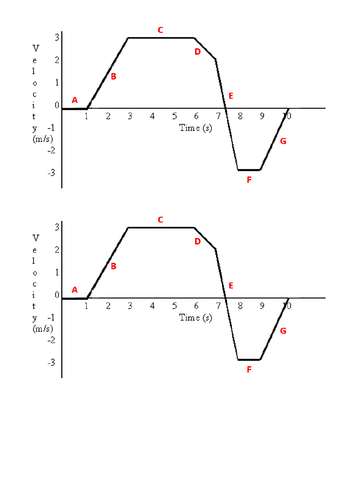
Understand what a horizontal line on a velocity-time graph tells you.
Understand how to use a velocity-time graph to work out whether an object is accelerating or decelerating.
Understand what the area under a velocity-time graph tells you (Higher)
Students will be assessed in the following ways
Plot a velocity-time graph from given data
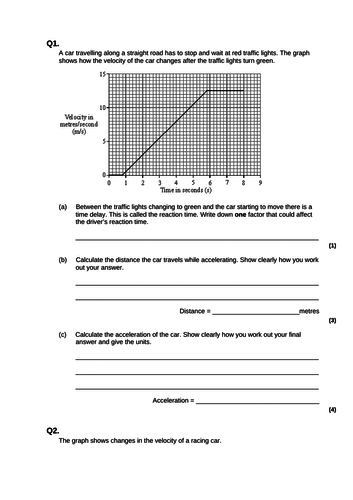
Calculate the acceleration from the gradient of a velocity-time graph
Describe the motion at various stages of a velocity time graph
Calculate the area under the graph for simple graphs.
Calculate the total distance travelled for complex graphs.
Calculate the distance travelled by counting squares
I have included a number of worksheets that accompany the PowerPoint.
Images that are not my own are referenced in the resource.
Something went wrong, please try again later.
Really great, thorough. Thank you from a non-specialist.
Report this resourceto let us know if it violates our terms and conditions.
Our customer service team will review your report and will be in touch.
£0.00