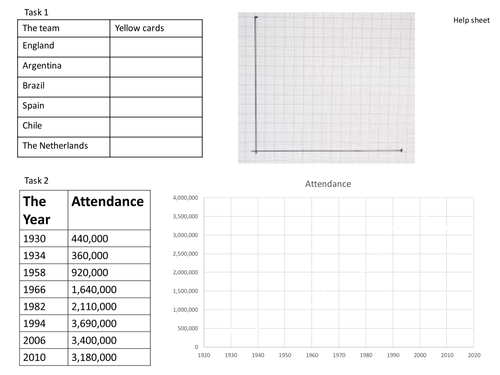
This is a lesson looking at how and when to draw different graphs, identifying variables and analysing a graph or data and planning an experiment. There are three different worksheets at the beginning to go with the PowerPoint, one for low ability, one for intermediate and one for high ability students to be printed off before the lesson.
Something went wrong, please try again later.
Perfect, just what I was looking for. thanks
My year 7 class loved this. My only slight issue was that the graph paper included on the handout was difficult to print correctly. This might just be down to my printer though. We looked up 2014 data to include as my year 7s are too young to remember the 2010 world cup(!) and I wanted data that they could interact with.
Very straightforward lesson on variables, not fond of the Do Now activity, suggest you have students try defining the two parts of the phrase or something more useful to their learning.
Report this resourceto let us know if it violates our terms and conditions.
Our customer service team will review your report and will be in touch.
£0.00
