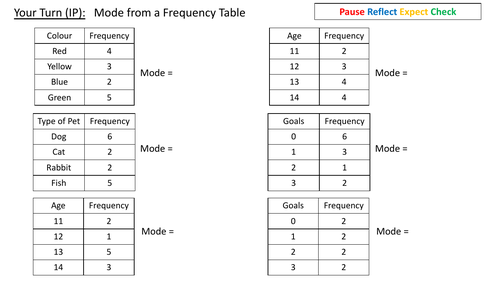


Calculate averages (mode, median, mean) and range from frequency tables.
PowerPoint includes fully animated examples, pictorial representations when applicable. Split screen with Teacher example and Pupil’s turn followed by questions with animated answers. Questions use intelligent practice to allow pupils to see links and build a deeper understanding of the topic.
Worksheets to be able to be printed for pupils to use and work on.
Something went wrong, please try again later.
This resource hasn't been reviewed yet
To ensure quality for our reviews, only customers who have downloaded this resource can review it
Report this resourceto let us know if it violates our terms and conditions.
Our customer service team will review your report and will be in touch.