


Complete KS3 lesson on continuous and discontinuous variation with histograms and bar charts: editable PowerPoint, worksheets, activity and answers.
Perfect for Year 8 Biology. Students define continuous and discontinuous variation, explain which graph to use for each, learn how to plot a histogram, and plot height and blood group data. Written for the Oxford Smart Activate 2, Activate 2 and AQA Activate 2 courses (Adaptation and inheritance, lesson 3.4 Continuous and discontinuous variation; 4.2 in Smart Activate 2), and suitable for any KS3 scheme of work.
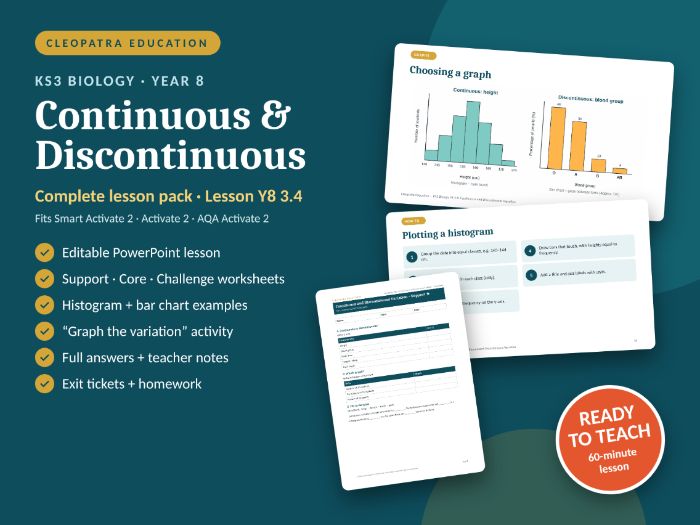
WHAT’S INCLUDED (6 editable files + PDF copies)
- Lesson PowerPoint – 20 slides
- Do Now retrieval starter
- Know / Explain / Apply learning objectives
- Key words with definitions
- Hook: “Line up!”
- Continuous vs discontinuous table
- Original histogram and bar chart
- How to plot a histogram
- Myth or fact? slide tackling common misconceptions
- “Continuous or discontinuous?” we-do task
- 2 hinge questions with explanations for every wrong answer
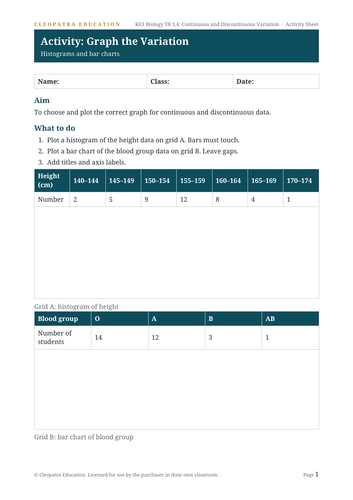
- “Graph the variation” activity
- Exit ticket and summary
- Hidden answer slides (they do not show in slideshow mode)
- Teacher notes on every slide
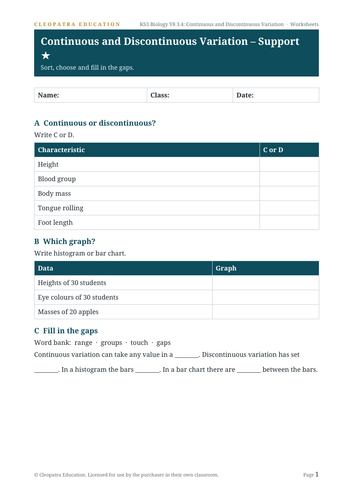
- Differentiated worksheets – Support ★, Core ★★ and Challenge ★★★
- Sort examples; choose the graph
- Gap fill
- Explain the two types; read a histogram
- Describe the distribution; percentage calculation
- Stretch (GCSE preview): many genes
- Activity sheet
- Plot a histogram of height data
- Plot a bar chart of blood group data
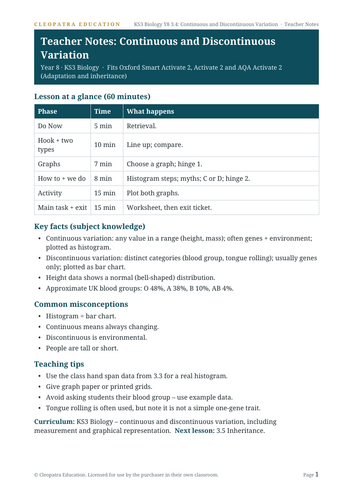
- One-page teacher notes – ideal for non-specialists
- Lesson timings (60 minutes)
- Key subject facts
- Common misconceptions
- Teaching tips
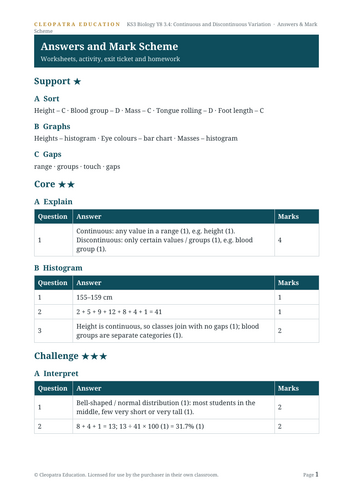
- Full answers and mark scheme
- Every worksheet level, the activity, the exit ticket and the homework, with marks
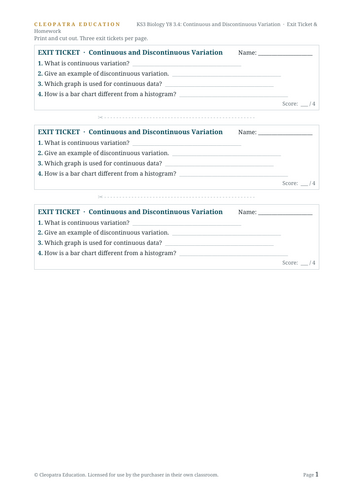
- Exit tickets (3 per page) + homework
- Homework reading “Blood Groups” with questions
CURRICULUM LINKS
- KS3 National Curriculum (Biology – Inheritance, chromosomes, DNA and genes): the variation between individuals within a species being continuous or discontinuous, to include measurement and graphical representation of variation.
- Working scientifically: present data in tables and graphs; choose the right type of graph.
FILE FORMATS
PowerPoint (.pptx) and Word (.docx) – fully editable. PDF copies included.
Previous lesson: 3.3 Variation. Next lesson: 3.5 Inheritance.
If you find this resource useful, please leave a review – it really helps! Visit the Cleopatra Education shop for more KS3 Biology lessons.
This resource is independently created and is not affiliated with or endorsed by Oxford University Press or AQA.
Something went wrong, please try again later.
This resource hasn't been reviewed yet
To ensure quality for our reviews, only customers who have purchased this resource can review it
Report this resourceto let us know if it violates our terms and conditions.
Our customer service team will review your report and will be in touch.
£3.00