

The A to Z of an enquiry. This is a fully differentiated and resourced enquiry/investigation into how the surface affects the amount of friction. It is suitable for UK levels 3 to 5 and some elements will start more able pupils thinking about some aspects of level 6 work. It consists of a 27 - slide slideshow and systematically takes the pupils through the stages of planning, developing and reflecting. The whole slideshow contains enough material for 3 to 4, one hour lessons depending on ability. The whole slideshow need not be covered and has been designed so that it is easy to select any sections that are required. It has also been designed so that there are challenging questions for more able pupils but clicking to the next slide provides support for those who need it. Many of the slides are animated.
The resource has been designed to be sufficiently versatile so as to be suitable as not only as an introduction to enquiry/investigation at secondary level but also for those pupils starting upon the transition from level 5 to level 6. It is full of tips on how to tackle the various parts of an enquiry which pupils will find beneficial for those enquiries they tackle in the future and for coping with enquiry-type questions in examinations.
The lessons are easy to follow, enjoyable and easy to teach.
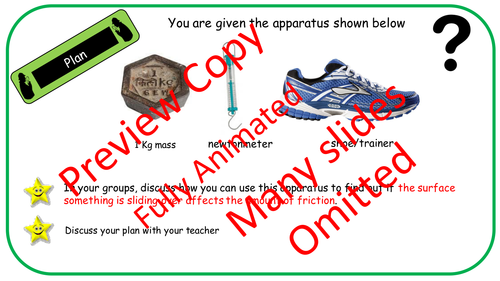
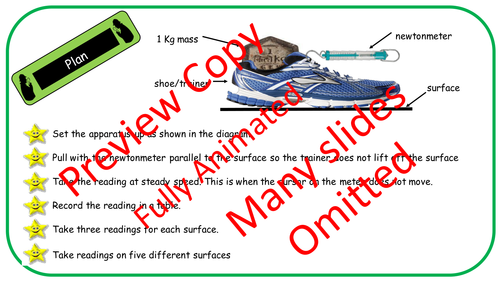
Apparatus needed per group is a newtonmeter and a 1Kg mass. I suggest you have an idea of the 5 surfaces to be used in advance and have a selection of different size newtonmeters available. I use the lab floor, the bench, the carpet in the corridor, a wooden dissection board and a Perspex safety screen. Groups of 3 or 4 are ideal.
Content
Definitions of independent, dependent and control variable, fair test and reliability.
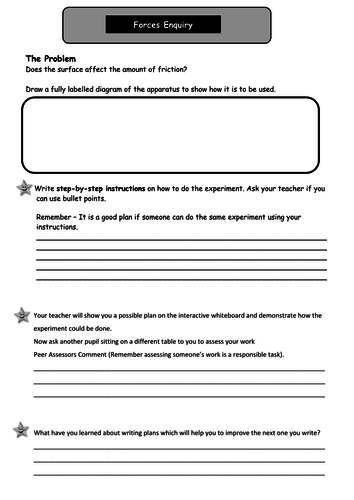
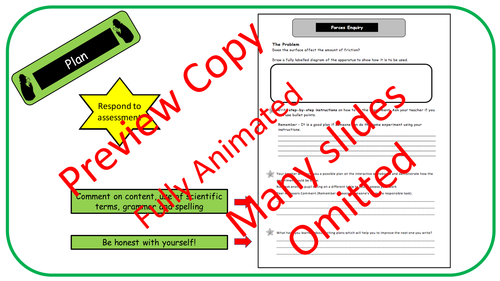
The problem posed is “Does surface affect the amount of friction”.
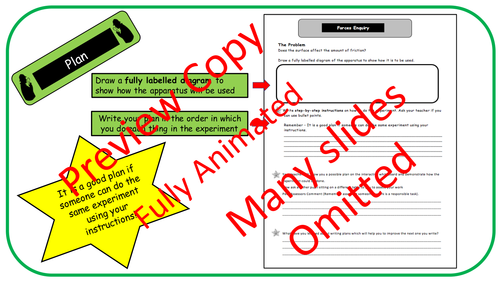
Planning the enquiry with a worksheet to accompany which includes peer assessment and pupil response to assessment.
Identification of variables
Writing a prediction
Writing success criteria
Designing a table
What is an anomalous result and how to recognise it.
Improvements
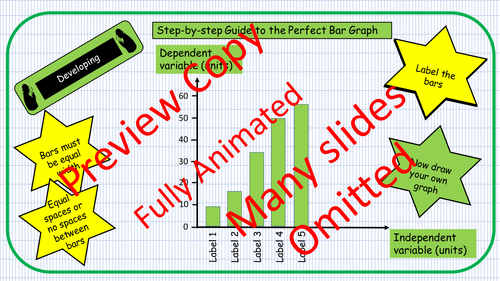
Selection of the correct type of graph
How to draw the perfect bar graph (animated)
Reliability and bias
Reflecting on success criteria and learning strategies.
I hope your classes enjoy this and do as well as mine.
Please remember to leave a review.
Why not have a look at my shop?
Something went wrong, please try again later.
This resource hasn't been reviewed yet
To ensure quality for our reviews, only customers who have purchased this resource can review it
Report this resourceto let us know if it violates our terms and conditions.
Our customer service team will review your report and will be in touch.
£3.10