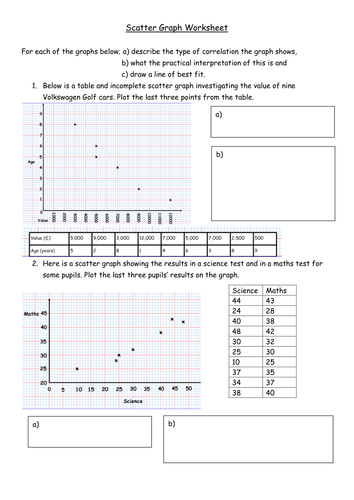

A scatter graphs GCSE worksheet in which students are required to plot missing points, describe the correlation and the practical interpretations, and then draw a line of best fit.
Can be extended if you pose questions on using the line of best fit to estimate one variable given a value for the other.
Something went wrong, please try again later.
Very useful for my Y7 and thanks for sharing for free
Perfect resource for mu mixed ability group of ASD students, thank you.
Excellent overview of types of correlation. Thank you!
Thank you so much - an excellent resource!
answers please
Report this resourceto let us know if it violates our terms and conditions.
Our customer service team will review your report and will be in touch.
£0.00