

This presentation has been made for SEN Y11 pupils but can be used for any class learning data representation. Includes pie charts, bar charts, line graphs, time-series graphs, scatterplots etc. Not all the content in the presentation is mine (credit to those who have made it)
Something went wrong, please try again later.
Some useful data questions here covering a variety of data topics. Thanks for sharing.
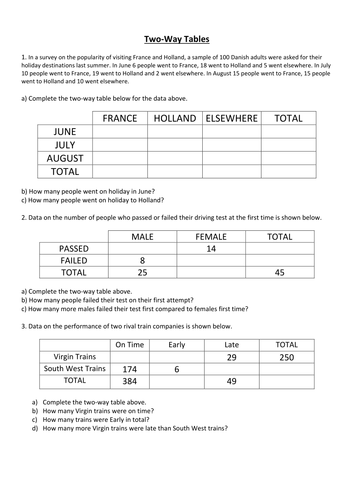
Nice two-way table activity, thanks
Report this resourceto let us know if it violates our terms and conditions.
Our customer service team will review your report and will be in touch.
£0.00
