

36Uploads
3k+Views
47Downloads
All resources
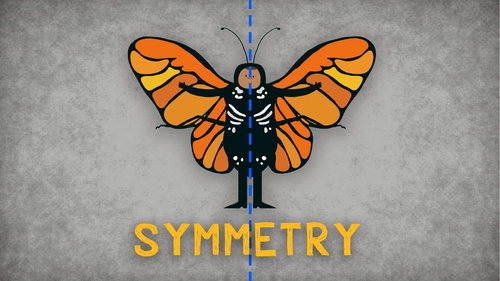
Symmetry Powerpoint
The presentation contains 22 SLIDES:
Definition of symmetry.
Line of symmetry.
Symmetric figures.
Horizontal symmetry with examples
Vertical symmetry with examples
Diagonal symmetry with examples
Figures having two lines of symmetry with examples.
Figures having multiple lines of symmetry with examples
Translational symmetry with examples.
Rotational symmetry with examples.
Reflection symmetry with examples.
Glide symmetry with examples.

Pie Chart Powerpoint
The presentation contains 20 SLIDES:
Learning Objectives.
Definition of a Pie Chart.
Tips for construction of pie chart.
Steps to construct a pie chart with an example.
Scaling and drawing a pie chart.
Read and Interpret a pie chart.
Synthetic Fibres and Plastics Powerpoint
The presentation contains 20 SLIDES:
Definition of fiber and its types.
Natural fibers with example.
Synthetic fibers with examples.
Types of synthetic fibers.
Rayon with example.
Nylon with example.
Polyester with example.
Acrylic with example.
Characteristics of synthetic fibers.
Plastic.
Characteristics of plastic.
Thermoplastic with examples.
Thermosetting plastics with examples.
Properties and uses of plastics.
Plastics are non –reactive.
Plastic is light, strong and durable.
Plastics are poor conductors.
Problems with the use of plastics.
Environmental friendly steps.
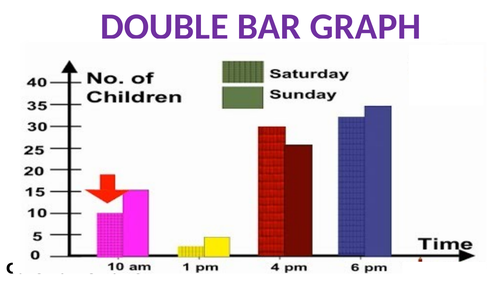
Double Bar Graph Powerpoint
The presentation contains 22 SLIDES:
Learning Objectives.
Definition of a double bar graph.
Parts of a double bar graph.
Difference between bar graph and double bar graph.
Tips for construction of double bar graph.
Steps to construct double bar graph with an example.
To read and interpret the double bar graph.
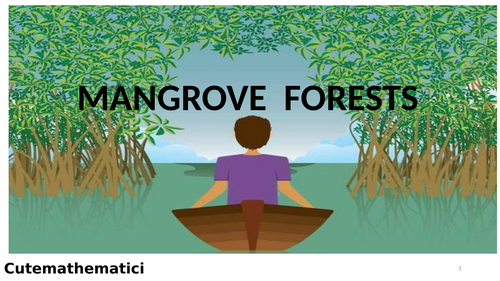
Mangrove Forests Powerpoint
The presentation contains 20 SLIDES:
Definition of mangrove.
Geographical Regions.
Geographical distribution of mangroves in India .
Types of mangroves.
Black mangrove with examples.
Red mangrove with examples.
White mangrove with examples.
Mangrove functions.
Mangrove uses.
Mangrove threats.
Mangrove restoration.

Air Pollution Powerpoint
The presentation contains 22 slides:
What is Air pollution ?
The types of air pollutants.
Sources of air pollution.
Natural Sources.
Human Sources.
Effects of air pollution on humans.
Smog.
Effects of Smog.
Chlorofluorocarbons.
Sources of chlorofluorocarbons.
Ozone Layer.
Hole in the ozone layer.
Effects of Ozone depletion.
Acid Rain.
Marble Cancer.
Greenhouse Effect.
Consequences of Global warming.
Frequency Distribution Table Powerpoint
Contains 20 slides
**Objective: The student will be able to organize the given data to a meaningful and understandable.
**
The presentation contains:
Definition of a Frequency Distribution Table.
Types of Frequency Distribution Table:
a) Discrete Frequency Distribution Table (Ungrouped).
b) Continuous Frequency Distribution Table (Grouped).
Uses of Frequency Distribution Data.
5 steps to construct a Frequency Distribution Table with one example on ungrouped data and two examples on grouped data.
Steps include how to
Draw the table arrange columns
Fill in the data in the first column
Tallying the observations in the second column
Summing up in the third column.
Under Grouped data we have one example each on the types
Types of Grouped Data:
a) Continuous Interval Form (Exclusive Form). e.g. overlapping
b) Discontinuous Interval Form (Inclusive Form). e.g. non - overlapping
To understand in details the difference between two class intervals
overlapping
Non- overlapping
To know different terms with examples
Class interval
Lower class limit
Upper class limit
Width of class interval
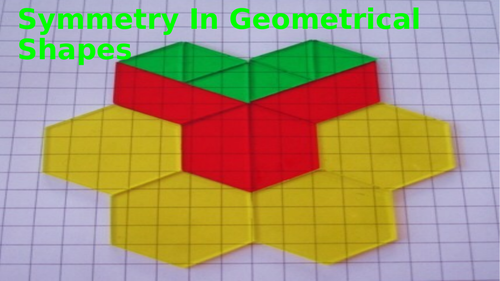
Symmetry in Geometrical Shapes Powerpoint
Contains 31 slides
Objective: The student will be able to identify whether a given shape has symmetry, to draw the line of symmetry, how many lines of symmetry a shape can have and the type of symmetry the shape has like horizontal, vertical and diagonal.
The Presentation contains:
The symmetry, lines of symmetry and the types of lines of symmetry of the given geometrical shapes.
Examples of Triangles:
Scalene Triangle
Equilateral Triangle
Isosceles Triangle
Isosceles Right Triangle
Circle
Semicircle
Quadrilateral and its examples
Trapezoid
Isosceles Trapezoid
Right Trapezoid
Parallelogram
Rectangle
Rhombus
Square
Kite
One example each for an irregular and regular polygon.
Pentagon
Hexagon
Heptagon
Octagon
Nonagon
Decagon
Dodecagon
The formula for the number of lines of symmetry a regular polygon can have through observations from the previous examples.
Line
Angle

PROFIT AND LOSS
Contains 15 slides
The presentation contains:
Definition of the terms Selling price and Cost price.
Formula for Selling price and Cost price.
Overhead charges definition i.e. How to calculate the total cost.
Two solved examples each on application of selling price and cost price.
Formula for Profit percentage and Loss percentage.
5 real life solved problems on finding different parameters of the profit percentage and loss percentage.
e.g. 1)How to find the profit when the profit percentage and total cost price is given.
2) To find the gain or loss percentage when a cost price and a selling price is given.
3) To find the selling price when the cost price and lost percentage is given.
4) To find the loss percentage when the selling price and loss price is given.
5) To find the cost price when the selling price and the loss percentage is given.

Condiments Powerpoint
The presentation contains 46 SLIDES:
Definition of a condiment
Functions and its properties
10 Classes of Condiments
List of condiments with examples
Salt and Sugar
Spices, powders or natural herbs
Definition of herb with examples like parsley, basil, thyme, sage, rosemary
Example of spice i) " Zaatar" its ingredients that are used to prepare it and its uses in dishes.
ii) " Paprika" and its uses in dishes.
Ketchup
The ingredients used to prepare it and its uses.
Pickles and Preserves with examples
e.g. Chutney and its types
South Asian Pickle
Fruit Preserves
Salad and Salad dressing
e.g Ranch Dressing
Thick Sauces with examples
Barbecue sauce
Chilly sauce and Chilly paste
Caramel
Mayonnaise
Salad and Salad Dressing
e.g. Ranch Dressing and its ingredients.
Mustard
Spreads and Pastes e.g Cheese, honey, Nut butters and Seed butters, Tahini ( seed butter)
Dips e.g Hummus , Guacamole
Oily and Liquidy Sauces e.g Fish sauce, soy sauce and olive oil
Vinegar and its types with examples
The Area and Circumference of the Circle Powerpoint
The presentation contains 44 SLIDES:
AREA OF A CIRCLE
Construction of formula to find the area of circle.
Finding the area of a circle using the formula.
Finding the area given the diameter and examples.
To calculate the area of the different shapes.
Area between Two Concentric Circles.
Example on two concentric circles.
CIRCUMFERENCE OF A CIRCLE
Definition of circumference.
The construction of formula of the circumference.
The relationship between the diameter and the radius of a circle.
Finding the circumference given the radius.
The value of π.
Examples of circumference.
Finding the radius given the circumference.
Finding the diameter given the circumference.
Find the perimeter of the given shapes.
Applications on the circumference.
Reproduction In Animals Powerpoint
The presentation contains 41 SLIDES:
Definition of Reproduction.
Modes of reproduction.
Asexual reproduction definition.
Definition of Binary fission with examples.
Binary fission in Amoeba.
Definition of Budding with examples.
Budding in Yeast.
Definition of fragmentation with examples.
Definition of sexual reproduction.
Male reproductive organ.
A sperm and its part.
Female reproductive organ.
An egg and its part.
Definition of fertilization.
Types of fertilization.
Definition of Internal fertilization with examples.
Fertilization in hens.
Types of internal fertilization.
Viviparous animals with examples.
Oviparous animals with examples.
Definition of External fertilization with examples.
Stages of Embryo development.
Metamorphosis in frog.
Metamorphosis in butterfly.
Area Powerpoint
The presentation contains 67 SLIDES:
AREA OF AREA OF TRIANGLE
Constructing the formula for area of a triangle.
Altitudes ( height) of a triangle.
Finding the area of the triangle.
Finding the height of the triangle.
Finding the base of the triangle.
Formula for area of an right angled triangle and its example.
Formula for area of an isosceles right angled triangle and its example.
Application on area of triangle.
AREA OF RECTANGULAR PATHS
Finding the area of the rectangular path.
Applications on rectangular path.
Finding the area of the cross paths.
Application on area of cross path.
AREA OF PARALLELOGRAM
What is parallelogram.
Constructing the formula for area of a parallelogram.
To locate the height for a given base.
Finding the area of the parallelogram.
Finding the height of the parallelogram.
Finding the base of the parallelogram.
Application on area of parallelogram.
AREA OF CIRCLE
Construction of formula to find the area of circle.
Finding the area of a circle using the formula.
Finding the area given the diameter and examples.
To calculate the area of the different shapes.
Area between Two Concentric Circles.
Example on two concentric circles.
Cube and Cube Roots Powerpoint
The presentation contains 82 SLIDES:
Understanding the cube.
Definition of the cube numbers.
The power notation of a cube number.
How to write and read the cube number.
Perfect Cubes from 1 to 1000.
Examples of cube numbers.
Pattern in cube numbers.
Properties of cube numbers
Numbers with their ones digit as 1 their cubes also will have the ones digit as 1.
Numbers with their ones digit as 4 or 5 their cubes also will have the ones digit as 4 or 5.
Numbers with their ones digit as 6 or 9 their cubes also will have the ones digit as 6 or 9.
Numbers with their ones digit as 0 their cubes also will have the ones digit as 0.
Numbers with their ones digit as 2 their cubes will have the ones digit as 8 and vice versa.
Numbers with their ones digit as 3 their cubes will have the ones digit as 7 and vice versa.
Examples on the above properties.
Cubes of Even numbers are Even.
Cube of Odd numbers are Odd.
Examples on the above properties.
The cube of a negative integer is negative.
Examples on the above property.
The cube of a rational number.
Examples on the above property.
Vocabulary of cube root.
The cube root symbol.
The working of a number having cube root.
Cube root for fractions.
Properties of a cube root.
Examples of a cube root.
Cube root of a negative number
Two ways to find cube roots.
Prime factorization with examples of whole number and decimal number.
Estimation with examples.
Symmetry Powerpoint
The presentation contains 100 SLIDES:
SYMMETRY
Definition of symmetry.
Line of symmetry.
Symmetric figures.
Horizontal symmetry with examples
Vertical symmetry with examples
Diagonal symmetry with examples
Figures having two lines of symmetry with examples.
Figures having multiple lines of symmetry with examples
Translational symmetry with examples.
Rotational symmetry with examples.
Reflection symmetry with examples.
Glide symmetry with examples.
Symmetry in all the 26 English alphabets.
Symmetry on all the numbers from 0 to 9.
The symmetry in geometrical shapes
e.g. Scalene Triangle
Equilateral Triangle
Isosceles Triangle
Isosceles Right Triangle
Circle
Semicircle
Quadrilateral and its examples
Trapezoid
Isosceles Trapezoid
Right Trapezoid
Parallelogram
Rectangle
Rhombus
Square
Kite
Pentagon and Regular Pentagon
Hexagon and Regular Hexagon
Heptagon and Regular Heptagon
Octagon and Regular Octagon
Nonagon
Decagon and Regular Decagon
Dodecagon
Line and Angle

Data Representation Powerpoint
The presentation contains 206 SLIDES: ( 2 COMPLETE LESSONS FREE)
TALLY MARKS
Definition of a tally mark.
Uses of tally mark.
How to count a tally mark.
Tally Mark Chart.
Construction of a tally mark table with an example.
Application on real life problems on tally mark.
Read and Interpret a tally mark table.
FREQUENCY DISTRIBUTION TABLE
Definition of a Frequency Distribution Table.
Types of Frequency Distribution Table:
a) Discrete Frequency Distribution Table (Ungrouped).
b) Continuous Frequency Distribution Table (Grouped).
Uses of Frequency Distribution Data.
5 steps to construct a Frequency Distribution Table with examples.
e.g. 1) Ungrouped Data.
2) Types of Grouped Data:
a) Continuous Interval Form (Exclusive Form).
b) Discontinuous Interval Form (Inclusive Form).
For Grouped data what are the types of class intervals
a) overlapping with example solved
b) non - overlapping with example solved.
PICTOGRAPH
Definition of a Pictograph.
Parts of a pictograph.
Tips for construction of pictograph.
Steps to construct pictograph with an example.
Scaling and drawing a pictograph.
Read and Interpret a pictograph.
BAR GRAPH
Definition of a bar graph.
Parts of a bar graph.
Tips for construction of bar graph.
Steps to construct bar graph with an example.
Types of bar graph.
Advantages of bar graph.
DOUBLE BAR GRAPH
Definition of a double bar graph.
Parts of a double bar graph.
Difference between bar graph and double bar graph.
Tips for construction of double bar graph.
Steps to construct double bar graph with an example.
To read and interpret the double bar graph.
LINE GRAPH
Definition of a line graph.
Parts of a line graph.
Tips for construction of line graph.
Steps to construct line graph with an example.
Reading and Interpreting a line graph.
Advantage of line graph.
PIE CHART
.
Definition of a Pie Chart.
Tips for construction of pie chart.
Steps to construct a pie chart with an example.
Scaling and drawing a pie chart.
Read and Interpret a pie chart.
HISTOGRAM
Definition of a Histogram.
Parts of a histogram.
Difference Between bar graph and histogram.
Types of intervals.
Tips for construction of bar graph.
Steps to construct bar graph with an example.
Read and Interpret a histogram.
DATA HANDLING
Statistics.
Fundamental Characteristics of Data.
Raw data.
Types of Data.
Data Handling Cycle.
Data Tabulation/ Recording of data .
Array with example.
Organisation of data.
Types of statistical data.
Tables e.g. Tally chart
Pictures e.g. Pictogram.
Graphs e.g. Bar graph, Pie chart, Line graph,
Diagrams e.g. Tree diagram, Venn diagram, Mapping or Arrow diagram.
Using ICT in data handling.
MEAN, MEDIAN, MODE AND RANGE
Central Tendency.
Importance of Central Tendency.
Types of measures of central tendency.
Mean and its examples.
Range and its examples.
Median and its examples.
Mode and its examples.