
66Uploads
6k+Views
5k+Downloads
All resources

Indirect Taxation WORKSHEET
A worksheet that tests understanding of directly and indirect taxation.
There are 4 activities in this worksheet:
A fill the blanks activity that tests students understanding of types of direct and indirect taxation and the correct terminology used depending on the tax being discussed
An activity where students need to calculate tax per unit, incidence on producers, consumers and government revenue
An activity where students need to explain why the incidence on the producer / consumer changes depending on the price elasticity of demand
An extension of activity 2 where students are given 4 additional diagrams where they need to complete additional calculations and label the incidence / tax revenue
3 multiple-choice questions on indirect taxation
Detailed answers of all* activities are provided in this worksheet
This activity took between 20 and 30 minutes for my students to complete


Payback Period (PBP) Worksheet
A simple worksheet where students need to calculate the payback period of 4 investment options.
Answer key included
Marketing Objectives
A colourful and engaging resource on Marketing Objectives.
Included in this presentation;
A colourful and informative title slide outlining learning objectives. This slide includes animations
A Catchphrase starter activity where students guess the name of a business or product fro a range of picture clues
A recap fill the blanks starter activity that tests what student have learned about marketing so far (PowerPoint slide can be printed for students and answer key included)
Explanation of aims, objectives and mission statements
Match the mission statement activity
Detailed and contextualised notes on marketing strategy, SMART objectives
There are 35 slides in total and this lesson took me an hour to complete

Finance Assembly Sixth Form
This PowerPoint contains 40 slides that informs sixth form students about managing their money effectively once they finish school or college regardless of whether they are entering employment, a university course or apprenticeship.
Included are:
Introductory information on number of students who don’t finish courses and apprenticeships and top 5 reasons why (number 2 being poor financial management)
Importance of budgeting
Overdrafts
Interest, EAR rate and APR rate
Credit cards
General advice
It took me 30 minutes to go through the presentation in assembly but can also be used in a lesson
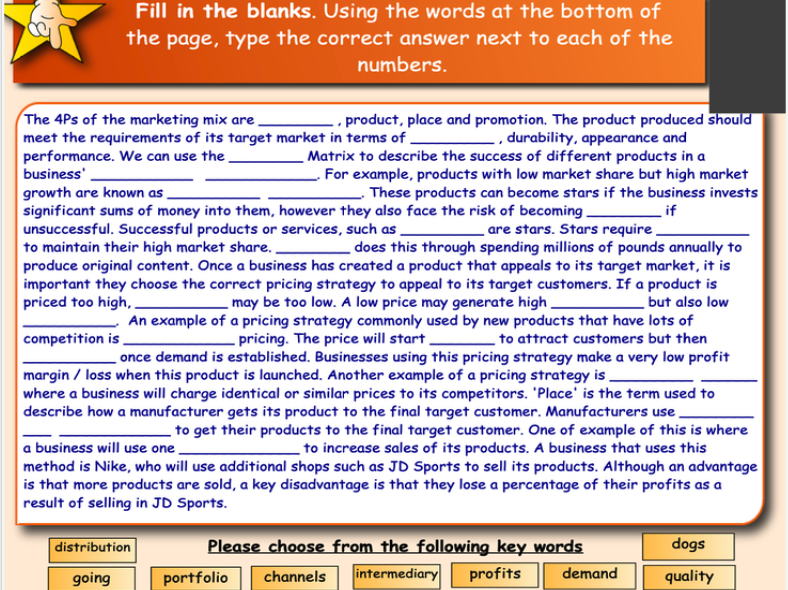
Marketing Mix RECAP STARTER
A fill the blanks activity on the 4Ps with emphasis on Boston Matrix
Answers are included
This is useful as a starter activity or plenary

Cash Flow Forecast Activity
Test your students’ knowledge of cash flow forecasts with this UNIQUE activity that demonstrates if students can calculate each of the different values.
This cash flow forecast contains a number of intentional errors that students need to identify and correct.
All instructions are included in the activity, but the key thing to note is that all yellow values cannot change, any others can.
Included in this activity are the following:
Page 1 - Instructions on how to complete the activity, a cash flow forecast (in colour) and an explanation of what the first error is and how it should have been calculated.
Page 2 - All errors have been circled. This can be shown after the cash flow forecast has been completed.
Pages 2 and 3 - Detailed explanations of all errors and how they should have been calculated.
Page 4 - The completed cash flow forecast with all answers.
How I run the activity:
Give students up to 10 minutes to complete the cash flow forecast
Once finished, ask students to explain any errors they have found (this took my class 10 minutes)
Show the circled errors on the board so that students can circle them
Explain each error in detail
Show the completed cash flow forecast on page 3 and get students to mark them. This will save you time.
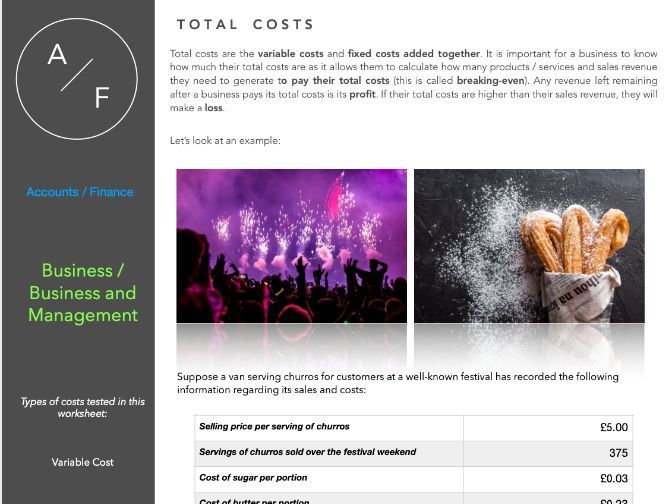
Types of Costs WORKSHEET (Fixed, Variable, Total, Average, Marginal, Direct, Indirect)
This worksheet contains revision notes and activities on how to calculate fixed costs, variable costs, total costs, average costs, marginal costs, direct costs and indirect costs)
All answers are included
The worksheet is colourful and creative throughout
This worksheet contains 7 pages of activities and took my students between 30 - 45 minutes to complete
Can be given as classwork / homework / revision
Inflation
Included in this PowerPoint:
A detailed and colourful title slide that outlines the key learning outcomes and equipment required for the lesson
A starter activity where students are required to guess how the price of 5 goods and services has changed over time (closest for each round wins). Students really enjoy this activity
Explanation of why / when inflation becomes a problem, how it affects incomes and sectors where incomes have risen lower and higher than inflation
Explanation in basket of goods / weighted index
Step by step explanation of how inflation is calculated using weighted index
Activity (with answers) where students are required to calculate inflation changes using a weighted index
Activity (with answers) - identify which goods and services have been recently added and removed from the basket of goods
Explanation of difference between demand-pull and cost-push inflation with examples
Diagrams for both types of inflation
Presentation is detailed and colourful throughout
There are 52 slides in total and this presentation took me an hour and a half to go through.

Cross Elasticity of Demand
This PowerPoint includes:
An activity that introduces students to the concept of complements, substitutes and unrelated goods
A activity where students have to match pairs of complement and substitutes goods
An activity where students have to calculate the XED of a pair of goods
Detailed notes on how to calculate XED and what the data means
This presentation contains 21 slides and took me 45minutes to complete
Marketing Mix - Place
Included in this presentation:
A fun Catchphrase starter activity (my students love this!)
A recap activity on cost-based pricing strategies with answers (feel free to remove or skip if you are you to cover this)
Notes and examples on the different methods of distribution
Notes on the pros and cons of each method of distribution
Notes on the importance of selecting the most appropriate method of distribution

Profitability Ratios (Gross Profit Margin, Operating Profit Margin, Return on Capital Employed)
A colourful and engaging resource designed for introducing profitability ratios (gross profit margin, operating profit margin and return on capital employed).
Included in this presentation:
A colourful title slide detailing the learning (lesson objectives) and equipment required for the lesson
Two detailed and colourful slides explaining what ratios analysis is and why it is conducted.
An introductory recap activity where students are required to calculate missing values for an income statement and balance sheet (answers provided)
Step by step and contextualised examples of how to calculate all three profitability ratios
Activities on all three ratios for students to complete (answers provided)
Explanations, analysis and evaluation of what could cause these ratios to improve and worsen.
This resource contains 29 slides and took me an hour and a half to fully go through.

Globalisation / Introduction to International Marketing
Using MCDONALD’S TSUKIMI BURGER, Tesco’s failure to succeed in the US, Apple’s failure to succeed in India, and many others, this PowerPoint seeks to explore the reasons why businesses wish to sell in international markets, the challenges and constraints.
Included in this PowerPoint:
A detailed title page, outlining the key skills covered in this topic
A recap on moving averages with answers. This topic is included in some syllabi earlier in the marketing unit but can be deleted if not required
A starter activity introducing the concept of globalisation where students need to match McDonalds products based on the country whey are sold
(demonstrating how products need to be adapted based on the market they are targeting). Answers are provided
An explanation of reasons why businesses choose to sell products in overseas markets
A contextualised example for each reason
Detailed explanations as to each of the reasons why how marketing activities need to change depending on which country goods are being sold
Video 1: Reasons why Tesco failed in US (poor marketing)
Video 2: Reasons why Apple failed in India (poor marketing)
Introduction to some of the factors that make trade between countries easier
This lesson took me an hour and a half to go through.

Capacity and Capacity Utilisation
A 52 slide presentation detailing capacity and capacity utilisation.
This presentation includes:
A depreciation starter activity
Introductory activity on the concept of capacity
Examples of capacity utilisation in different contexts
Calculation activity
Activity demonstrating hoe capacity utilisation impacts costs / average costs
Detailed notes throughout
This lesson took me an hour to go through.

Indirect Taxation - Economics
This presentation contains 73 slides and introduces what tax is before going into detail about indirect taxation and how to interpret diagrams that ask questions on indirect taxation.
Included in this presentation:
A Catchphrase starter activity
A true of false short quiz that asks students about 4 different types of tax around the world
Information about how much tax is generated in UK compare to poorer countries, what that tax revenue is spent on and how it is sourced
Distinctions between direct and indirect taxes. Although Econs exams focus more on indirect taxes, explaining direct taxes gets students engaged into the lesson
A ‘how much tax does BOJO pay’ activity that students really enjoy
Notes on indirect taxation
A step by step explanation of how to interpret and make calculations on tax diagrams
A calculation activity that students need to complete
Notes on disadvantages of tax increases
Evaluative suggestion points the extent to which tax rises are harmful
These slides took me an hour and a half to go through with my students.
Net Present Value
Net Present Value is a topic that students often find challenging. This presentation has been produced so that students of all abilities can access the topic. Using lots of colour and engaging slides, contextualised examples as well as step by step examples, this presentation has proven to be very successful in getting my students to understand this net present value effectively.
Included in this presentation:
A detailed title slide including key skills covered in the lesson and equipment required
Initial starter activity where students need to calculate the payback period and average (accounting) rate of return. The aim of this activity is to get students to think about how using both of these methods can provide conflicting results (one investment option could have a shorter payback period where the other could have a higher average rate of return). Activity and answers included in slide, as well as explanation of how these figures were calculated.
Step by step guidance as to what the net present value and time value of money means (we look at why it is better to have £100 now rather than next year)
Activities that explain what inflation and interest rates are, and how they affect the value of money (guess the price activity can be done on mini whiteboards or completed as a class)
Step by step guide demonstrating how net present value is calculated
An explanation of how net present value can be applied to investment decisions
An evaluation of the usefulness of net present value, with examples provided.
This presentation contains 53 slides and took me just under 2 hours to go through in detail.

Demand and the Demand Curve
A PowerPoint presentation on demand includes:
Catchphrase starter activity
Demand activity (graph paper required)
Detailed explanations of demand, reasons for shape of demand curve, movements, shifts, ceteris paribus
This lesson took me 60 minutes to go through

Break-Even Analysis Worksheet
4 Practice break-even diagram questions with answers provided
Can be printed used in lessons or as revision

Balance Sheets (Statement of Financial Position)
The topic of balance sheets is one that many students (as well as teachers!) find challenging to grasp… This colourful, informative and engaging lesson has been created with this in mind by breaking down the topic down and guiding students step-by-step, using a range of clear explanations, fun activities and demonstrations. Colour, appealing fonts and images have been used throughout.
Included in this presentation:
A colourful and informative title slide, outlining key concepts, skills and learning objectives.
Three starter activities (for the purpose of differentiation) that reviews what the income statement is, how different values are calculated as well as profitability ratios. Each activity has differing levels of difficulty, so you may do as many or as little as you choose. Detailed answers to each activity are provided.
An embedded link to a Kahoot Quiz I have created is imbedded on one slide, and introduces students to concepts of assets, liabilities and equity. The Kahoot has 10 questions where students have to answer mind-blowing facts about Apple, such as how many patents its owns and the amount of cash they have in the bank. Each question contains an image / gif to engage students.
Detailed, broken down and contextualised explanations of types of assets and liabilities
An activity where students need to identify types of assets (answers provided)
An activity where students need to categories assets, liabilities and equity
Step by step instructions (using engaging colours) to explain how the balance sheet is calculated
An easy to understand explanation as to why the balance sheet has its name, and assets / equity and liabilities are always equal
Explanation of why balance sheets are produced and what many of its uses are
A challenging activity where students need to calculate values in a balance sheet.
I have found this resource great in helping students understand the topic and is a great introduction to future topics, such as liquidity ratios.
This lesson took me 3 x 45 lessons to complete as I used all three starter activities with my students.
File size is just over 400MB