

I used this resource as a homework with my Year 10 group after finishing work on statistical diagrams and the calculation of averages and the range.
It has at least one question on each of the following:
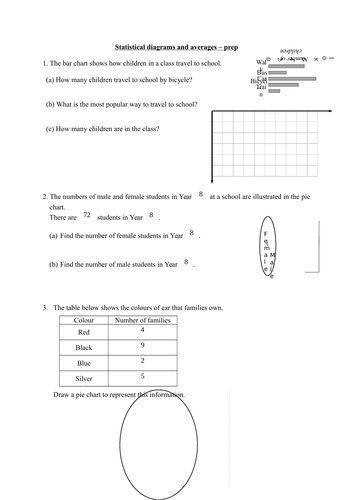
1. Bar charts
2. Pie charts
3. Mode, median, mean and range from a list of data
4. Finding the missing value in a set of data given the mode/median/mean.
5. Finding the new mean after a data point is added/removed.
6. Finding averages from a frequency table and a grouped frequency table.
Fully-worked solutions are provided.
It has at least one question on each of the following:
1. Bar charts
2. Pie charts
3. Mode, median, mean and range from a list of data
4. Finding the missing value in a set of data given the mode/median/mean.
5. Finding the new mean after a data point is added/removed.
6. Finding averages from a frequency table and a grouped frequency table.
Fully-worked solutions are provided.
Something went wrong, please try again later.
This resource hasn't been reviewed yet
To ensure quality for our reviews, only customers who have downloaded this resource can review it
Report this resourceto let us know if it violates our terms and conditions.
Our customer service team will review your report and will be in touch.
£0.00