
A FULL LESSON on interpreting and drawing distance-time graphs.
We are learning about: Distance-time graphs
We are learning to: Interpret and draw distance-time graphs in context.
Differentiated objectives:
- Developing learners will be able to interpret information from distance-time graphs.
- Secure learners will be able to identify the scale used on distance-time graphs.
- Excelling learners will be able to plot information onto a distance-time graph.
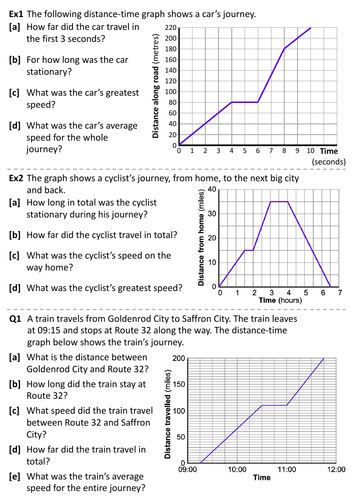
Starter: Clear demonstration of how the first example’s distance-time graph is constructed (Inspired by GeoGebra Traffic)
Main: Walkthrough examples followed by practice questions on worksheets. All solutions given on PPT.
Something went wrong, please try again later.
Great resource, and free! thank you
Quite possibly the best resource I have seen on TES. Thank you so much.
fantastic resource. Well thought out and executed! I am so grateful for your assistance!
Please can we have more bundles :)
Very good powerpoint and worksheet
Report this resourceto let us know if it violates our terms and conditions.
Our customer service team will review your report and will be in touch.
£0.00