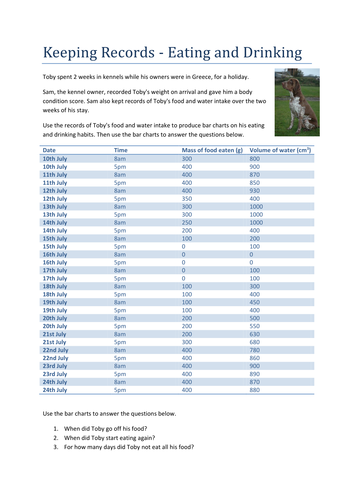


A powerpoint quiz to start the lesson and then a graph plotting activity to both practise plotting and analysis skills. Pupils can use their imagination to explain the graph they draw. The graph work is on canine eating and drinking and is set in a simple scenario. The numbers of the first data set are very simple to plot for less able students. The second data set is a little more challenging, both could be easliy adapted to your own students needs. Lesson fits with the BTEC First Level 2 Scheme of work for lesson 7 in Animal Care. Unit One Animal Health Topic A1 Monitoring Signs of good and ill health in animals.
Get this resource as part of a bundle and save up to 29%
A bundle is a package of resources grouped together to teach a particular topic, or a series of lessons, in one place.
Something went wrong, please try again later.
This resource hasn't been reviewed yet
To ensure quality for our reviews, only customers who have purchased this resource can review it
Report this resourceto let us know if it violates our terms and conditions.
Our customer service team will review your report and will be in touch.
£3.00
