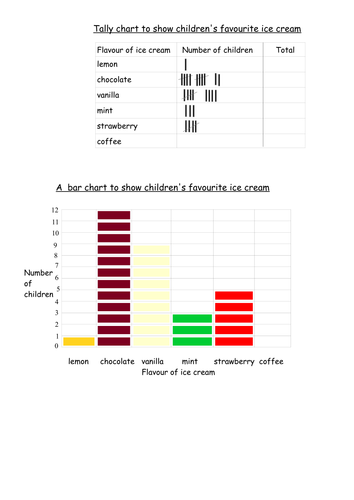


I had to do the graphs in pdf due to compatibility issues. Hopefully you can edit or write over the presentations with a SMART pen or something similar. The questions for the interpreting lesson are in Word though which can be adapted. The first lesson is interpreting tally and bar charts (ice cream flavours and how children come to school). The two LA (lower ability) documents go together: the activity and the questions. Accordingly the MA/HA (middle/higher ability) activity and questions documents go together. It is all in the correct order. The second lesson is creating their own tally and bar charts based on hair colour after first looking at how children come to school as the example done together in the modelling as a class. The first lesson is differentiated two ways and the second is three ways. Read the plan for details. Remember to emphasise STARTING AT ZERO for the scale. You can go up in twos for the scale if preferable.
Something went wrong, please try again later.
I like the steps highlighted when teaching children how to tally.
Report this resourceto let us know if it violates our terms and conditions.
Our customer service team will review your report and will be in touch.
£0.00