


Develop your students’ graph skills with this engaging KS3 diffusion investigation.
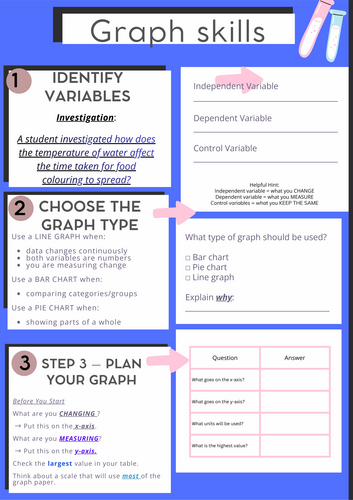
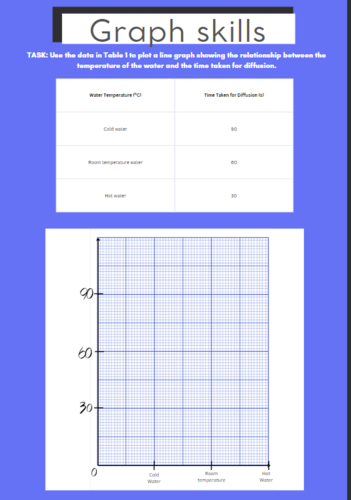
Students investigate how the temperature of water affects the time taken for food colouring to diffuse, while developing key Working Scientifically and graphing skills.
Includes:
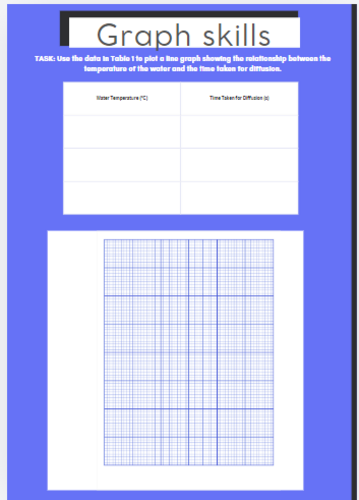
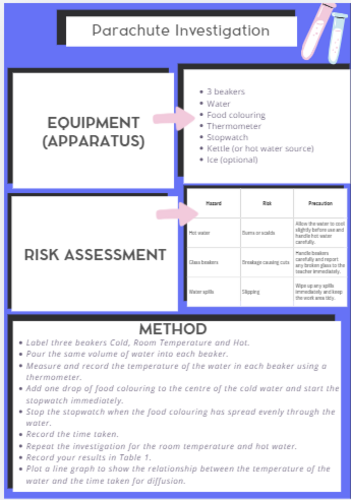
- Diffusion investigation worksheet
- Equipment, method and risk assessment
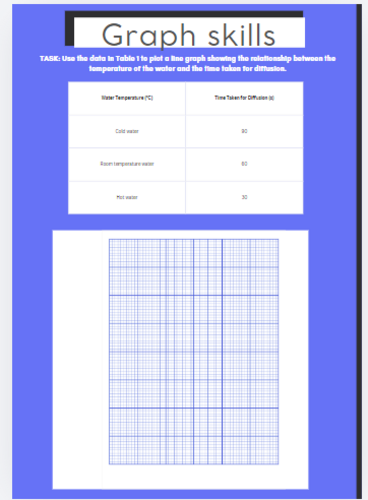
- Results table
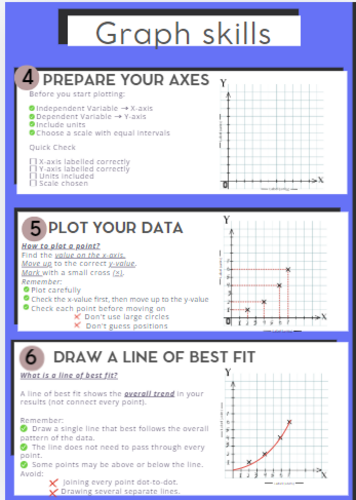
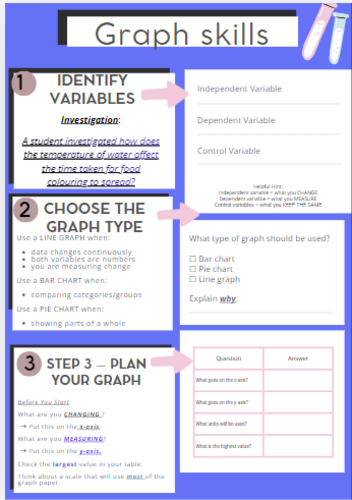
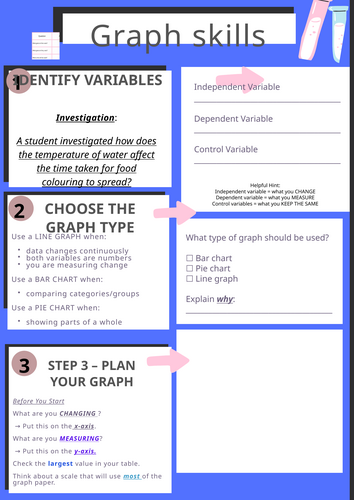
- Scaffolded graph skills activities
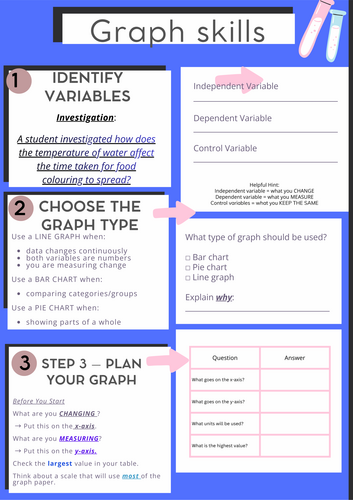
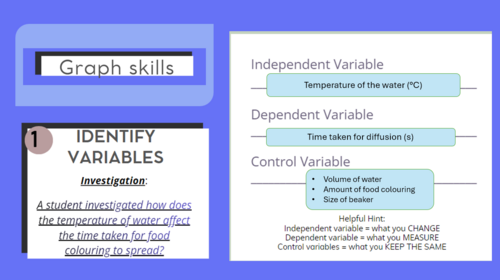
- Independent, dependent and control variables
- Graph planning and scaling
- Graph interpretation questions
- Editable PowerPoint
- PowerPoint with answers
Perfect for Year 7, Year 8 and KS3 Working Scientifically lessons. Ideal for teaching line graphs, variables, data analysis and practical investigation skills.
Something went wrong, please try again later.
This resource hasn't been reviewed yet
To ensure quality for our reviews, only customers who have purchased this resource can review it
Report this resourceto let us know if it violates our terms and conditions.
Our customer service team will review your report and will be in touch.
£3.00