


Allow students to explore probability distributions and statistical sampling in real-time with this Biased Coin Simulator Task. Students will also develop strong ICT skills as they get the opportunity to create and test their own copy of this simulator in a Microsoft Excel Macro-Enabled Workbook.
The Simulator
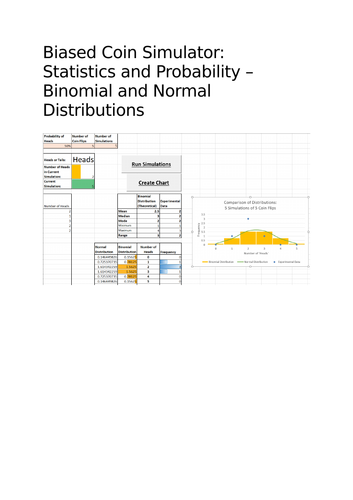
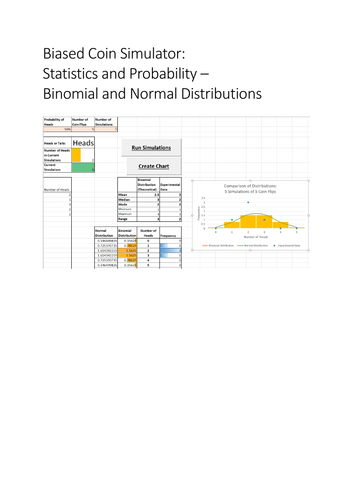
In the Biased Coin Simulator the probability of the coin landing on heads can be adjusted to any value between 0 and 1. The Bernoulli trial of flipping the coin is repeated (the simulator can handle over one thousand coin-flips), recording the number of times the coin landed on heads in the Bernoulli trials. This simulation then repeated a set number of times and the results are grouped and compared to the expected binomial distribution of the parameters set in the simulator.
The experimental data is collated in a frequency table and compared with the theoretical binomial distribution through a back-to-back histogram. There is also a table to summary statistics (mean, median, mode, and range) of the theoretical binomial distribution to the experimental data obtained by the simulation.
The Central Limit Theorem states that as the number of trials increases, a binomial distribution will get closer and closer to a normal distribution. To illustrate this, the normal distribution of the simulation for the parameters set is shown in the column next to the binomial distribution. Once the simulation has been run, a chart can be generated that overlays experimental data, binomial distribution, and normal distribution on the same axes for easy visual comparison.
What’s Included
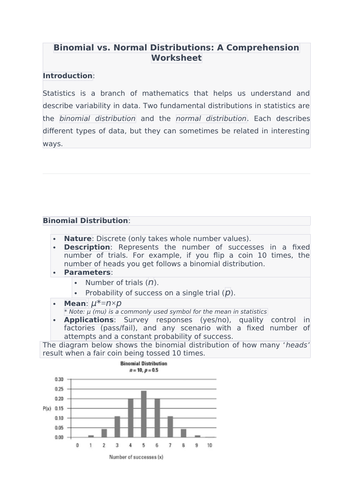
- Pre Task - Binomial vs Normal Distribution: A resource providing information on both binomial and normal distributions; outlining the similarities and differences. There are questions at the end for students to develop their understanding.
- Excel Instructions: Provides context behind the simulator as well as a detailed step-by-step guide on how to create it from the blank template provided.
- Biased Coin Simulator: A Microsoft Excel Macro-Enabled Workbook of the simulator described above. There is a fully complete version for teacher reference and an incomplete template for students to finish using the instructions provided.
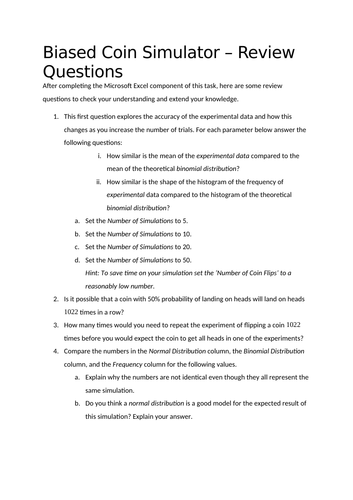
- Post Task - Understanding Questions: Questions to deepen and extend students understanding of the statistical concepts relevant to the task.
I created this resource as part of a Year 9 Statistics unit; however everything included is fully editable and can be used in a variety of different ways.
Key Benefits for Educators:
- Holistic Approach
- Hands-on Learning
- Critical Thinking
- Flexibility
- Cross-Curriculum Links
Introduce this task into your program and watch as your students navigate the fascinating realm of probability with enthusiasm and curiosity!
Something went wrong, please try again later.
This resource hasn't been reviewed yet
To ensure quality for our reviews, only customers who have downloaded this resource can review it
Report this resourceto let us know if it violates our terms and conditions.
Our customer service team will review your report and will be in touch.
£0.00