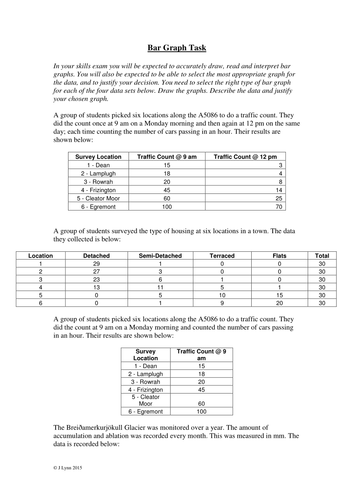
Worksheet on drawing line and bar graphs using examples. Students are given data, have to choose the right type of graph (e.g. compound, comparative etc.), draw the graph, describe the data and justify the use of their chosen graph. Originally for AS and A Level Geography but will meet requirements for the New Spec (9-1) GCSE as well as the 2016 New Spec A Level courses given the emphasis on justify the type of presentation used. Could also be used with high ability KS3 classes and in other subjects.
Perfect either as an activity during first teaching or as a revision task. Most classes take around 45 mins to do either section (bar or line).
Included are a .pdf of the task
Please do not remove my name from these resources. I have worked hard in my own time to produce them.
Perfect either as an activity during first teaching or as a revision task. Most classes take around 45 mins to do either section (bar or line).
Included are a .pdf of the task
Please do not remove my name from these resources. I have worked hard in my own time to produce them.
Something went wrong, please try again later.
This resource hasn't been reviewed yet
To ensure quality for our reviews, only customers who have purchased this resource can review it
Report this resourceto let us know if it violates our terms and conditions.
Our customer service team will review your report and will be in touch.
£2.00
