Graphing, Trends, Correlation, Extrapolation Bundle with Audio Support 2026
Resource Bundle
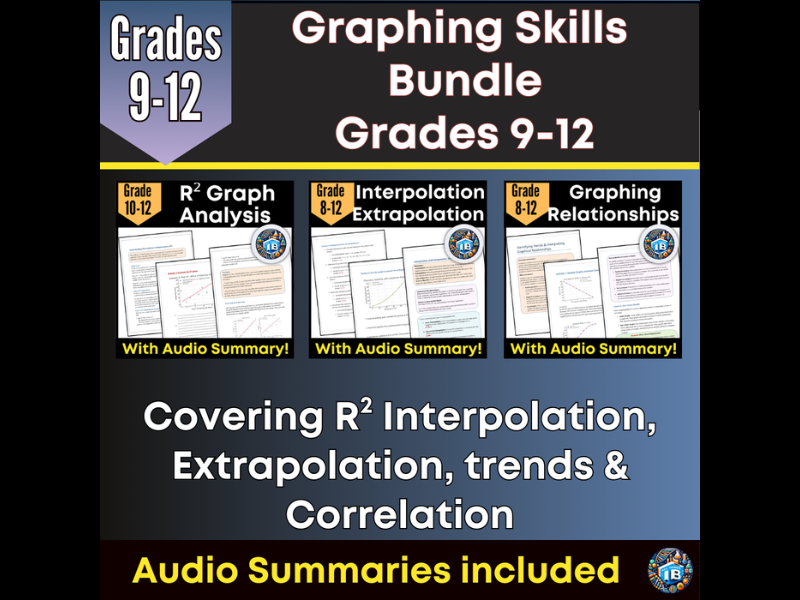
Graphing and Data Interpretation Skills Bundle Worksheets with Audio Summaries
This bundle brings together a set of structured worksheets designed to build confidence in graphing, data analysis, and statistical interpretation. Covering key skills such as interpreting graphs, identifying trends, understanding correlation, interpolation, extrapolation, and working with R², these resources help students make sense of data visually and mathematically.
Suitable for secondary mathematics and science classrooms, the bundle supports learners in developing the analytical skills needed to interpret real data, explain relationships, and draw justified conclusions.
What This Bundle Includes
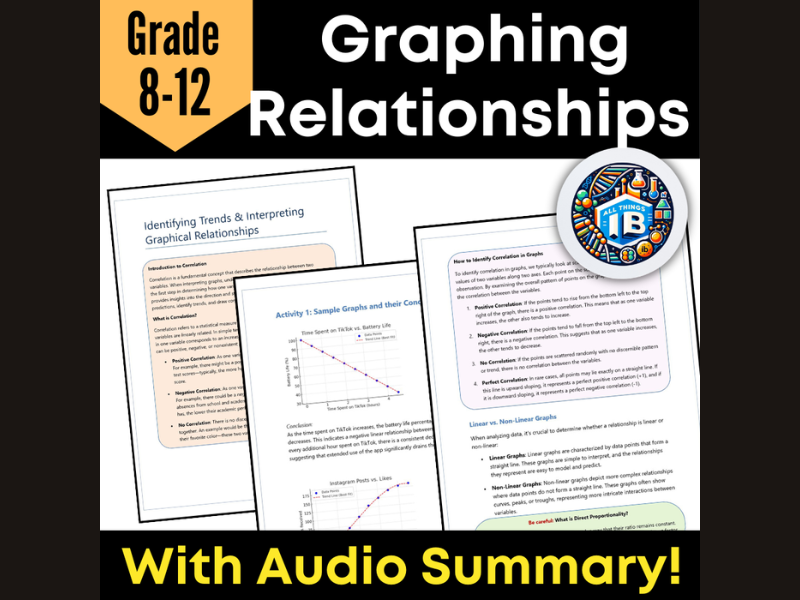
• Worksheets on interpreting graphs and identifying trends
• Activities focused on correlation and data relationships
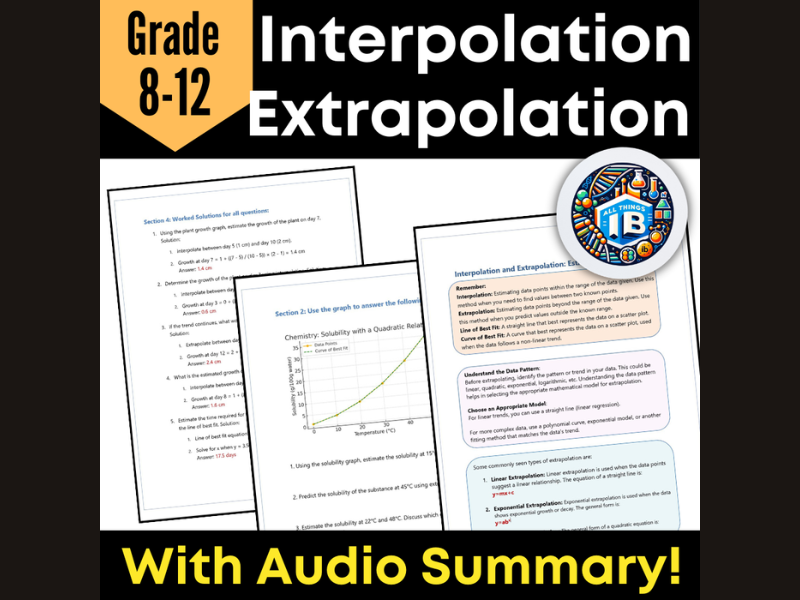
• Lessons on interpolation and extrapolation
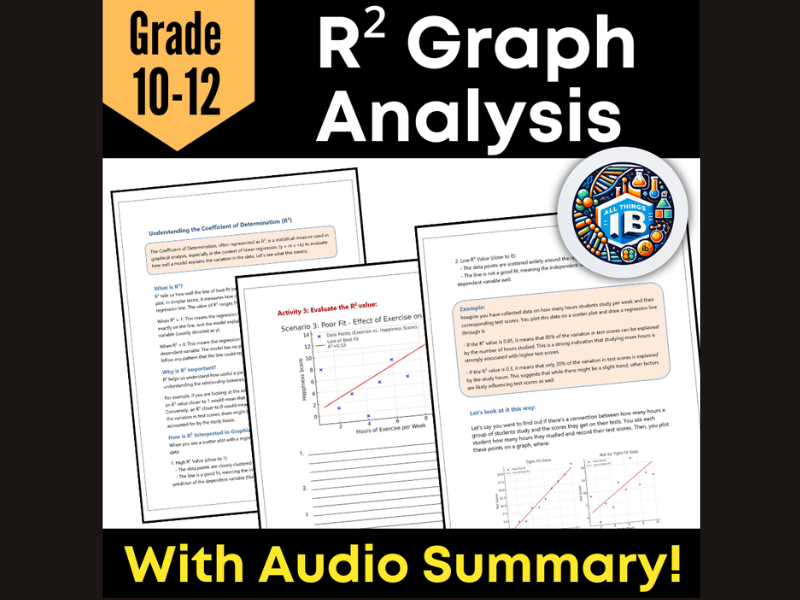
• Graphical analysis tasks involving coefficient of determination (R²)
• Realistic data scenarios for applied learning
• Podcast-style audio summaries for each topic
• Print and digital-friendly formats
Learning Focus
Graph Interpretation
Students practise reading a variety of graph types and extracting meaningful information from visual data.
Trend and Correlation Analysis
Learners identify positive, negative, and no-correlation patterns, and describe the strength and direction of relationships.
Prediction Skills
Through interpolation and extrapolation tasks, students learn how to estimate values carefully and understand the reliability of predictions.
Model Understanding
R² activities introduce students to evaluating how well a model explains variation in data.
Contextual Thinking
Real-world scenarios encourage students to link graphs and statistics to scientific and everyday contexts.
Audio Learning Support
Each topic includes a short podcast-style audio summary that reinforces key concepts. This supports auditory learners and provides an easy way to revisit learning outside of class.
Skills Developed
Plotting and analysing graphs
Identifying trends and relationships
Understanding correlation and model fit
Making and justifying predictions
Explaining data in written form
Ideal For
Secondary maths and science lessons
Data and statistics units
Revision and consolidation activities
Homework or independent practice
Building cross-curricular data literacy
This bundle helps students move beyond simply drawing graphs to understanding what the data shows and how to communicate it clearly. By combining structured worksheets with audio reinforcement, it supports different learning styles while strengthening core analytical skills across STEM subjects.
Something went wrong, please try again later.
This resource hasn't been reviewed yet
To ensure quality for our reviews, only customers who have purchased this resource can review it
Report this resourceto let us know if it violates our terms and conditions.
Our customer service team will review your report and will be in touch.