

Speed-Time Graphs
Key Stage: 3 ★★
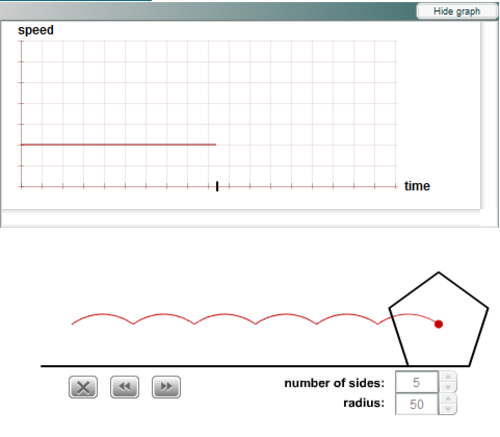
A regular polygon rolls along, and the graph plots the speed of the dot.How do the location of the dot and the number of sides affect the graph?
This problem provides a visual context in which to consider how speed-time graphs represent movement over time. It allows opportunity for learners to discuss and refine their ideas. Asking learners to predict, to justify their predictions and to consider modifying their views can help address misconceptions and improve understanding.
This resource has comprehensive teachers' notes and resources, linked from the problem page. This includes possible approaches and key questions, as well as possible support and extensions.
The file attached is a HTML file, which, when opened, automatically redirects you to the problem on the NRICH website.
Key Stage: 3 ★★
A regular polygon rolls along, and the graph plots the speed of the dot.How do the location of the dot and the number of sides affect the graph?
This problem provides a visual context in which to consider how speed-time graphs represent movement over time. It allows opportunity for learners to discuss and refine their ideas. Asking learners to predict, to justify their predictions and to consider modifying their views can help address misconceptions and improve understanding.
This resource has comprehensive teachers' notes and resources, linked from the problem page. This includes possible approaches and key questions, as well as possible support and extensions.
The file attached is a HTML file, which, when opened, automatically redirects you to the problem on the NRICH website.
Something went wrong, please try again later.
This is a very good resource and the reason I like this lesson is because it offers pupils something different by combining two seperately taught topics of speed/distance/time with polygons. This could be used as an nvestigation to see what happens when the red dot is moved on the different shapes, and can be extended for the more able. The whole lesson even comes with a card sort activity which s great.
Report this resourceto let us know if it violates our terms and conditions.
Our customer service team will review your report and will be in touch.
£0.00