
This worksheet accompanies our short film (www.bigpictureeducation.com/fat-experiment), in which we conduct a curry-tasting experiment.
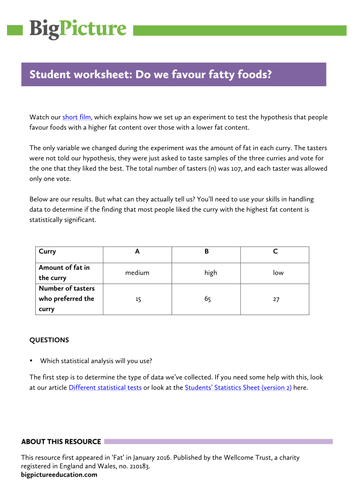
Students should watch the short video and then use the data generated to determine if the finding that most people liked the curry with the highest fat content is statistically significant.
This worksheet guides students through the process of selecting the correct statistical test to analyse the data generated from the video experiment. The worksheet also contains questions about how the student could manipulate the experimental design to understand more about people's preferences for fatty foods.
This is part of Big Picture: Fat, published in January 2016. See www.bigpictureeducation.com/fat
Something went wrong, please try again later.
This resource hasn't been reviewed yet
To ensure quality for our reviews, only customers who have downloaded this resource can review it
Report this resourceto let us know if it violates our terms and conditions.
Our customer service team will review your report and will be in touch.
£0.00