
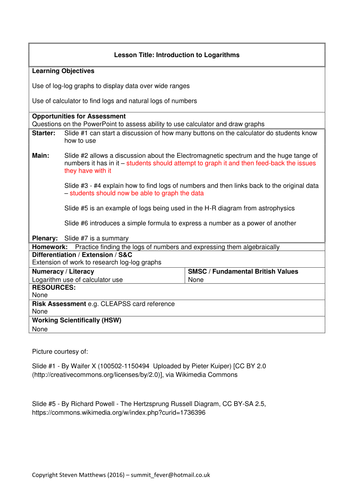
This is the first of three lessons that introduce the idea of logarithms
The PowerPoint takes students through the difficulties in graphing data of wide ranging numbers and then, using the E-M spectrum and H-R diagrams, shows how log-log graphs can be used to display this data.
This is part of the essential mathematics skills needed for A-Level Physics
The PowerPoint takes students through the difficulties in graphing data of wide ranging numbers and then, using the E-M spectrum and H-R diagrams, shows how log-log graphs can be used to display this data.
This is part of the essential mathematics skills needed for A-Level Physics
Get this resource as part of a bundle and save up to 25%
A bundle is a package of resources grouped together to teach a particular topic, or a series of lessons, in one place.
Something went wrong, please try again later.
Thank you
An excellent starting point for covering logarithms. Thanks.
Report this resourceto let us know if it violates our terms and conditions.
Our customer service team will review your report and will be in touch.
£3.00